Polish vs Immigrants from Indonesia Ambulatory Disability
COMPARE
Polish
Immigrants from Indonesia
Ambulatory Disability
Ambulatory Disability Comparison
Poles
Immigrants from Indonesia
6.2%
AMBULATORY DISABILITY
26.3/ 100
METRIC RATING
197th/ 347
METRIC RANK
5.5%
AMBULATORY DISABILITY
99.9/ 100
METRIC RATING
44th/ 347
METRIC RANK
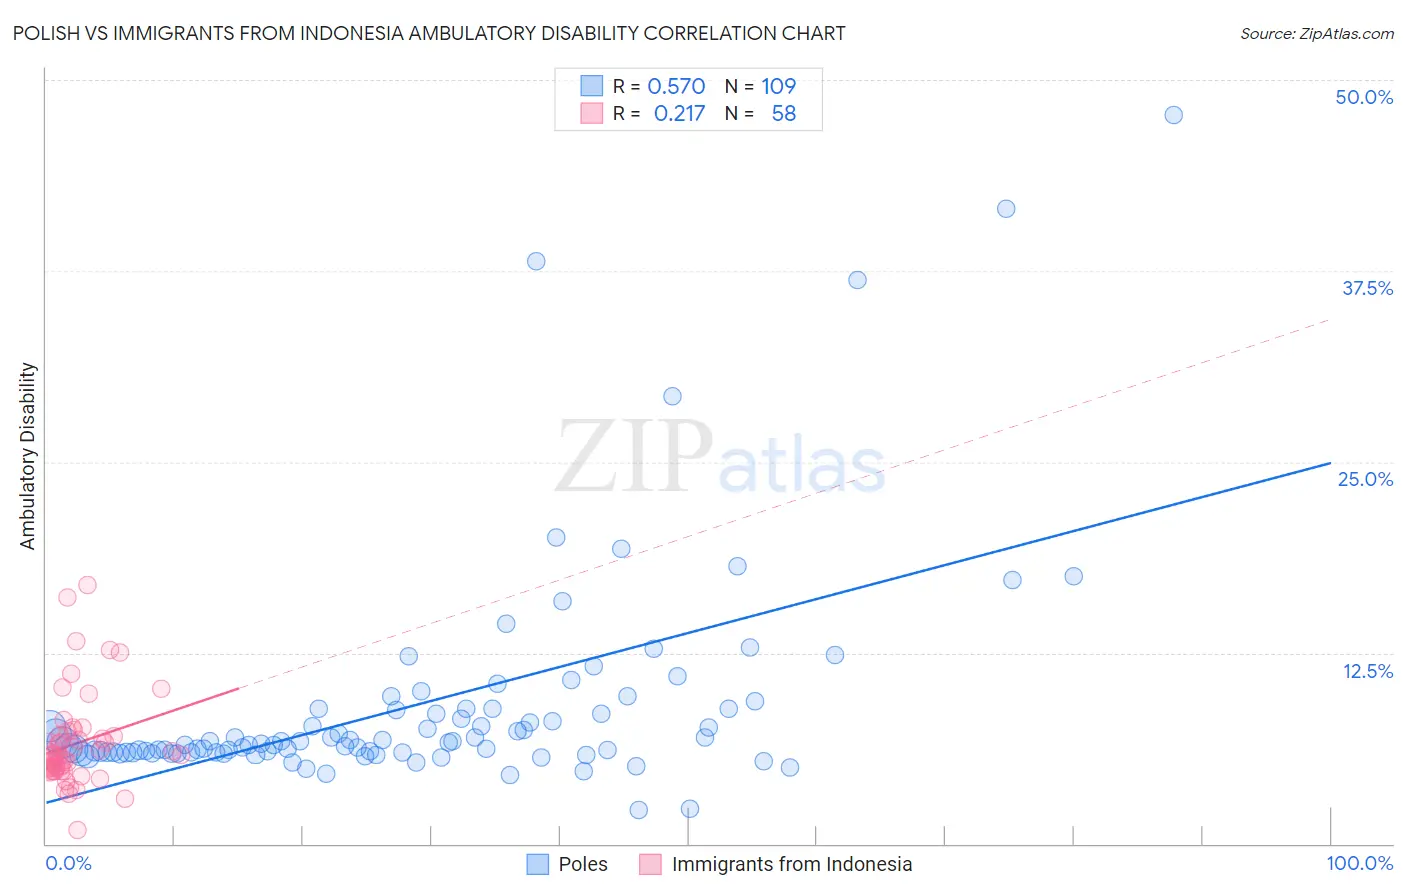
Polish vs Immigrants from Indonesia Ambulatory Disability Correlation Chart
The statistical analysis conducted on geographies consisting of 560,051,234 people shows a substantial positive correlation between the proportion of Poles and percentage of population with ambulatory disability in the United States with a correlation coefficient (R) of 0.570 and weighted average of 6.2%. Similarly, the statistical analysis conducted on geographies consisting of 215,776,699 people shows a weak positive correlation between the proportion of Immigrants from Indonesia and percentage of population with ambulatory disability in the United States with a correlation coefficient (R) of 0.217 and weighted average of 5.5%, a difference of 11.8%.
Ambulatory Disability Correlation Summary
| Measurement | Polish | Immigrants from Indonesia |
| Minimum | 2.2% | 0.92% |
| Maximum | 47.7% | 16.9% |
| Range | 45.5% | 16.0% |
| Mean | 9.1% | 6.5% |
| Median | 6.6% | 5.8% |
| Interquartile 25% (IQ1) | 6.0% | 4.8% |
| Interquartile 75% (IQ3) | 8.8% | 7.1% |
| Interquartile Range (IQR) | 2.8% | 2.3% |
| Standard Deviation (Sample) | 7.4% | 3.0% |
| Standard Deviation (Population) | 7.3% | 3.0% |
Similar Demographics by Ambulatory Disability
Demographics Similar to Poles by Ambulatory Disability
In terms of ambulatory disability, the demographic groups most similar to Poles are Malaysian (6.2%, a difference of 0.12%), Immigrants from Bangladesh (6.2%, a difference of 0.12%), Belgian (6.2%, a difference of 0.15%), Alaska Native (6.2%, a difference of 0.23%), and Guatemalan (6.2%, a difference of 0.24%).
| Demographics | Rating | Rank | Ambulatory Disability |
| Immigrants | Western Africa | 33.4 /100 | #190 | Fair 6.2% |
| Immigrants | Guatemala | 31.9 /100 | #191 | Fair 6.2% |
| Immigrants | Western Europe | 31.6 /100 | #192 | Fair 6.2% |
| Guatemalans | 30.0 /100 | #193 | Fair 6.2% |
| Alaska Natives | 29.8 /100 | #194 | Fair 6.2% |
| Belgians | 28.6 /100 | #195 | Fair 6.2% |
| Malaysians | 28.2 /100 | #196 | Fair 6.2% |
| Poles | 26.3 /100 | #197 | Fair 6.2% |
| Immigrants | Bangladesh | 24.6 /100 | #198 | Fair 6.2% |
| Italians | 22.6 /100 | #199 | Fair 6.2% |
| Immigrants | Cambodia | 21.5 /100 | #200 | Fair 6.2% |
| Immigrants | Central America | 20.1 /100 | #201 | Fair 6.2% |
| Albanians | 19.7 /100 | #202 | Poor 6.2% |
| Immigrants | Ukraine | 18.4 /100 | #203 | Poor 6.2% |
| Immigrants | Congo | 18.2 /100 | #204 | Poor 6.2% |
Demographics Similar to Immigrants from Indonesia by Ambulatory Disability
In terms of ambulatory disability, the demographic groups most similar to Immigrants from Indonesia are Paraguayan (5.5%, a difference of 0.12%), Immigrants from Sweden (5.6%, a difference of 0.17%), Egyptian (5.6%, a difference of 0.18%), Immigrants from Japan (5.6%, a difference of 0.18%), and Immigrants from Argentina (5.6%, a difference of 0.19%).
| Demographics | Rating | Rank | Ambulatory Disability |
| Turks | 100.0 /100 | #37 | Exceptional 5.5% |
| Cypriots | 100.0 /100 | #38 | Exceptional 5.5% |
| Immigrants | Eritrea | 100.0 /100 | #39 | Exceptional 5.5% |
| Venezuelans | 99.9 /100 | #40 | Exceptional 5.5% |
| Mongolians | 99.9 /100 | #41 | Exceptional 5.5% |
| Argentineans | 99.9 /100 | #42 | Exceptional 5.5% |
| Paraguayans | 99.9 /100 | #43 | Exceptional 5.5% |
| Immigrants | Indonesia | 99.9 /100 | #44 | Exceptional 5.5% |
| Immigrants | Sweden | 99.9 /100 | #45 | Exceptional 5.6% |
| Egyptians | 99.9 /100 | #46 | Exceptional 5.6% |
| Immigrants | Japan | 99.9 /100 | #47 | Exceptional 5.6% |
| Immigrants | Argentina | 99.9 /100 | #48 | Exceptional 5.6% |
| Bulgarians | 99.9 /100 | #49 | Exceptional 5.6% |
| Luxembourgers | 99.9 /100 | #50 | Exceptional 5.6% |
| Taiwanese | 99.8 /100 | #51 | Exceptional 5.6% |