Polish vs Moroccan Ambulatory Disability
COMPARE
Polish
Moroccan
Ambulatory Disability
Ambulatory Disability Comparison
Poles
Moroccans
6.2%
AMBULATORY DISABILITY
26.3/ 100
METRIC RATING
197th/ 347
METRIC RANK
6.1%
AMBULATORY DISABILITY
52.6/ 100
METRIC RATING
171st/ 347
METRIC RANK
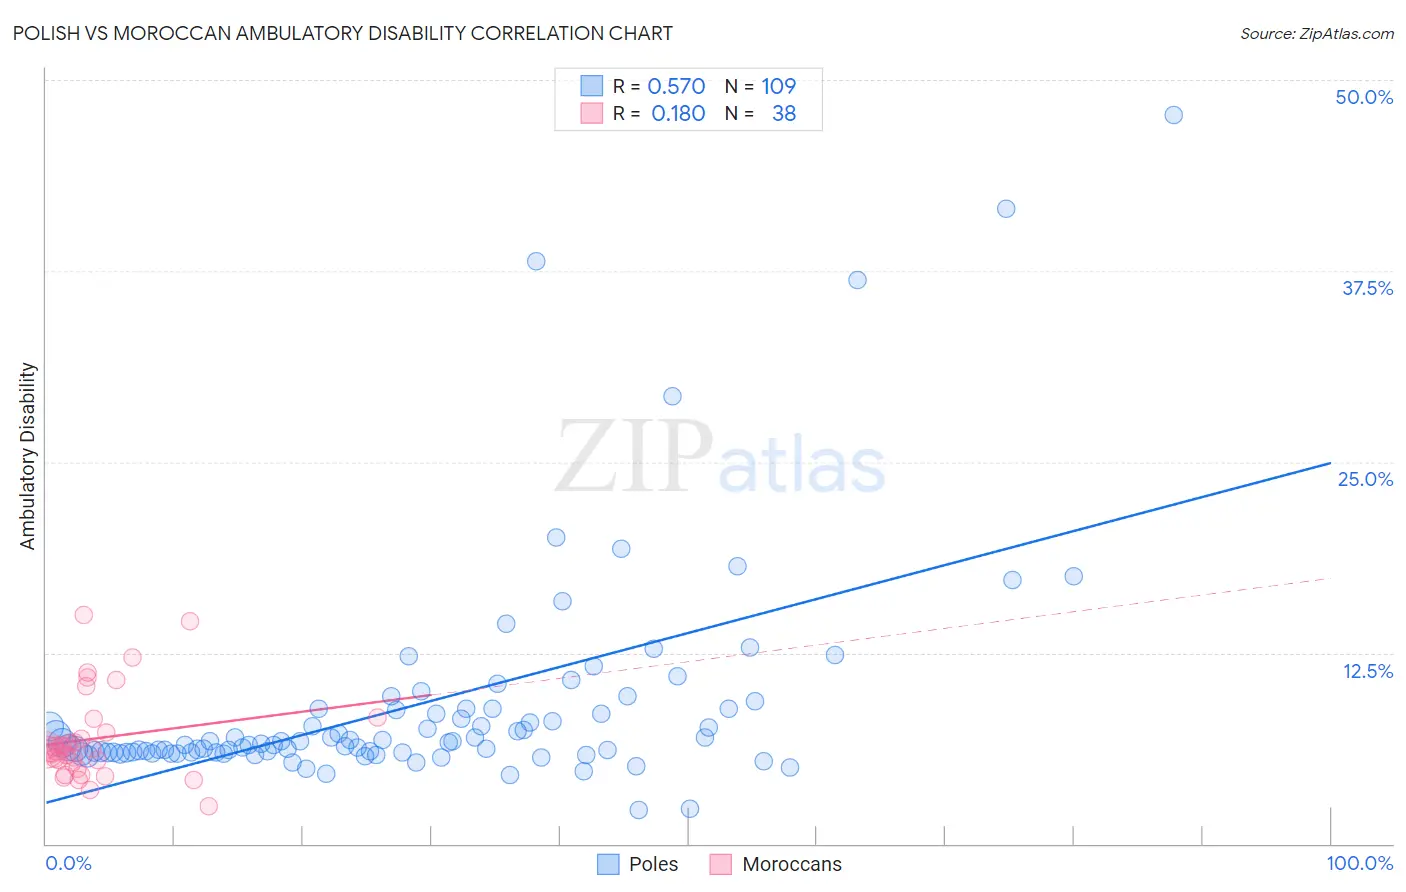
Polish vs Moroccan Ambulatory Disability Correlation Chart
The statistical analysis conducted on geographies consisting of 560,051,234 people shows a substantial positive correlation between the proportion of Poles and percentage of population with ambulatory disability in the United States with a correlation coefficient (R) of 0.570 and weighted average of 6.2%. Similarly, the statistical analysis conducted on geographies consisting of 201,789,132 people shows a poor positive correlation between the proportion of Moroccans and percentage of population with ambulatory disability in the United States with a correlation coefficient (R) of 0.180 and weighted average of 6.1%, a difference of 1.5%.
Ambulatory Disability Correlation Summary
| Measurement | Polish | Moroccan |
| Minimum | 2.2% | 2.5% |
| Maximum | 47.7% | 15.0% |
| Range | 45.5% | 12.5% |
| Mean | 9.1% | 6.9% |
| Median | 6.6% | 6.2% |
| Interquartile 25% (IQ1) | 6.0% | 5.3% |
| Interquartile 75% (IQ3) | 8.8% | 7.3% |
| Interquartile Range (IQR) | 2.8% | 2.0% |
| Standard Deviation (Sample) | 7.4% | 2.9% |
| Standard Deviation (Population) | 7.3% | 2.8% |
Similar Demographics by Ambulatory Disability
Demographics Similar to Poles by Ambulatory Disability
In terms of ambulatory disability, the demographic groups most similar to Poles are Malaysian (6.2%, a difference of 0.12%), Immigrants from Bangladesh (6.2%, a difference of 0.12%), Belgian (6.2%, a difference of 0.15%), Alaska Native (6.2%, a difference of 0.23%), and Guatemalan (6.2%, a difference of 0.24%).
| Demographics | Rating | Rank | Ambulatory Disability |
| Immigrants | Western Africa | 33.4 /100 | #190 | Fair 6.2% |
| Immigrants | Guatemala | 31.9 /100 | #191 | Fair 6.2% |
| Immigrants | Western Europe | 31.6 /100 | #192 | Fair 6.2% |
| Guatemalans | 30.0 /100 | #193 | Fair 6.2% |
| Alaska Natives | 29.8 /100 | #194 | Fair 6.2% |
| Belgians | 28.6 /100 | #195 | Fair 6.2% |
| Malaysians | 28.2 /100 | #196 | Fair 6.2% |
| Poles | 26.3 /100 | #197 | Fair 6.2% |
| Immigrants | Bangladesh | 24.6 /100 | #198 | Fair 6.2% |
| Italians | 22.6 /100 | #199 | Fair 6.2% |
| Immigrants | Cambodia | 21.5 /100 | #200 | Fair 6.2% |
| Immigrants | Central America | 20.1 /100 | #201 | Fair 6.2% |
| Albanians | 19.7 /100 | #202 | Poor 6.2% |
| Immigrants | Ukraine | 18.4 /100 | #203 | Poor 6.2% |
| Immigrants | Congo | 18.2 /100 | #204 | Poor 6.2% |
Demographics Similar to Moroccans by Ambulatory Disability
In terms of ambulatory disability, the demographic groups most similar to Moroccans are Immigrants from Burma/Myanmar (6.1%, a difference of 0.020%), Immigrants from Ecuador (6.1%, a difference of 0.070%), Croatian (6.1%, a difference of 0.080%), Immigrants from Canada (6.1%, a difference of 0.14%), and Immigrants from Southern Europe (6.1%, a difference of 0.29%).
| Demographics | Rating | Rank | Ambulatory Disability |
| Basques | 63.7 /100 | #164 | Good 6.1% |
| Nicaraguans | 63.2 /100 | #165 | Good 6.1% |
| Iraqis | 62.8 /100 | #166 | Good 6.1% |
| Immigrants | Oceania | 60.7 /100 | #167 | Good 6.1% |
| Ecuadorians | 60.5 /100 | #168 | Good 6.1% |
| Immigrants | Southern Europe | 58.1 /100 | #169 | Average 6.1% |
| Immigrants | Ecuador | 53.8 /100 | #170 | Average 6.1% |
| Moroccans | 52.6 /100 | #171 | Average 6.1% |
| Immigrants | Burma/Myanmar | 52.2 /100 | #172 | Average 6.1% |
| Croatians | 51.2 /100 | #173 | Average 6.1% |
| Immigrants | Canada | 50.0 /100 | #174 | Average 6.1% |
| Vietnamese | 47.2 /100 | #175 | Average 6.1% |
| Immigrants | North America | 45.6 /100 | #176 | Average 6.1% |
| Immigrants | England | 45.4 /100 | #177 | Average 6.1% |
| Scandinavians | 44.5 /100 | #178 | Average 6.1% |