Polish vs Immigrants from Europe Average Family Size
COMPARE
Polish
Immigrants from Europe
Average Family Size
Average Family Size Comparison
Poles
Immigrants from Europe
3.09
AVERAGE FAMILY SIZE
0.0/ 100
METRIC RATING
341st/ 347
METRIC RANK
3.15
AVERAGE FAMILY SIZE
0.5/ 100
METRIC RATING
279th/ 347
METRIC RANK
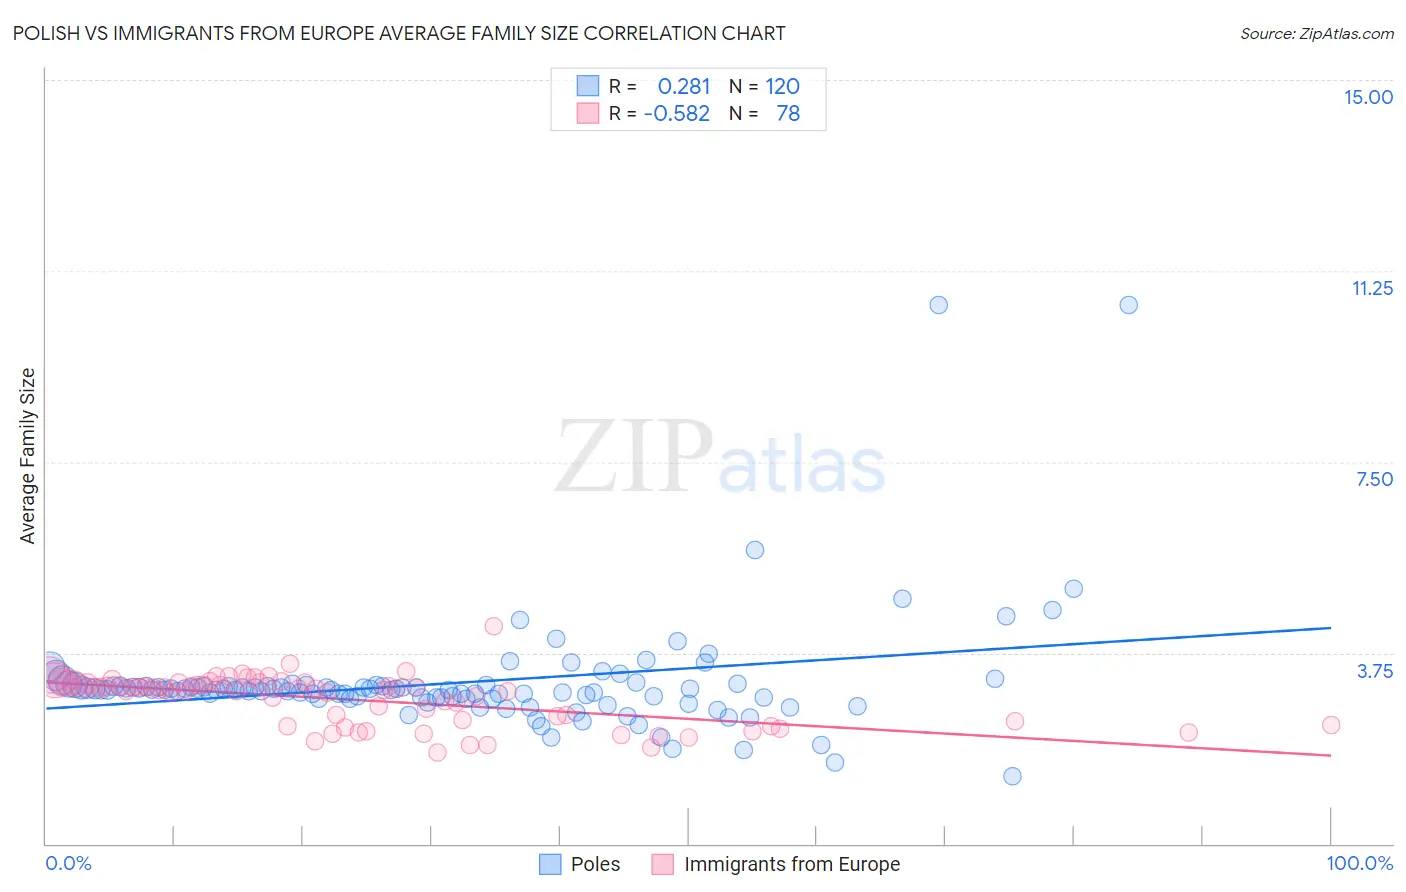
Polish vs Immigrants from Europe Average Family Size Correlation Chart
The statistical analysis conducted on geographies consisting of 559,976,913 people shows a weak positive correlation between the proportion of Poles and average family size in the United States with a correlation coefficient (R) of 0.281 and weighted average of 3.09. Similarly, the statistical analysis conducted on geographies consisting of 546,902,968 people shows a substantial negative correlation between the proportion of Immigrants from Europe and average family size in the United States with a correlation coefficient (R) of -0.582 and weighted average of 3.15, a difference of 1.8%.
Average Family Size Correlation Summary
| Measurement | Polish | Immigrants from Europe |
| Minimum | 1.32 | 1.78 |
| Maximum | 10.58 | 4.28 |
| Range | 9.26 | 2.50 |
| Mean | 3.15 | 2.84 |
| Median | 3.03 | 3.04 |
| Interquartile 25% (IQ1) | 2.87 | 2.40 |
| Interquartile 75% (IQ3) | 3.10 | 3.16 |
| Interquartile Range (IQR) | 0.23 | 0.76 |
| Standard Deviation (Sample) | 1.13 | 0.48 |
| Standard Deviation (Population) | 1.13 | 0.47 |
Similar Demographics by Average Family Size
Demographics Similar to Poles by Average Family Size
In terms of average family size, the demographic groups most similar to Poles are Finnish (3.09, a difference of 0.050%), German (3.09, a difference of 0.14%), Croatian (3.10, a difference of 0.19%), French (3.10, a difference of 0.21%), and Swedish (3.10, a difference of 0.23%).
| Demographics | Rating | Rank | Average Family Size |
| Estonians | 0.0 /100 | #333 | Tragic 3.10 |
| Lithuanians | 0.0 /100 | #334 | Tragic 3.10 |
| Luxembourgers | 0.0 /100 | #335 | Tragic 3.10 |
| Irish | 0.0 /100 | #336 | Tragic 3.10 |
| Swedes | 0.0 /100 | #337 | Tragic 3.10 |
| French | 0.0 /100 | #338 | Tragic 3.10 |
| Croatians | 0.0 /100 | #339 | Tragic 3.10 |
| Finns | 0.0 /100 | #340 | Tragic 3.09 |
| Poles | 0.0 /100 | #341 | Tragic 3.09 |
| Germans | 0.0 /100 | #342 | Tragic 3.09 |
| Norwegians | 0.0 /100 | #343 | Tragic 3.08 |
| French Canadians | 0.0 /100 | #344 | Tragic 3.07 |
| Slovenes | 0.0 /100 | #345 | Tragic 3.07 |
| Slovaks | 0.0 /100 | #346 | Tragic 3.06 |
| Carpatho Rusyns | 0.0 /100 | #347 | Tragic 3.06 |
Demographics Similar to Immigrants from Europe by Average Family Size
In terms of average family size, the demographic groups most similar to Immigrants from Europe are Okinawan (3.15, a difference of 0.020%), Immigrants from England (3.15, a difference of 0.030%), Swiss (3.15, a difference of 0.040%), Immigrants from Bosnia and Herzegovina (3.15, a difference of 0.060%), and Immigrants from Denmark (3.15, a difference of 0.060%).
| Demographics | Rating | Rank | Average Family Size |
| Immigrants | Lithuania | 0.6 /100 | #272 | Tragic 3.15 |
| New Zealanders | 0.6 /100 | #273 | Tragic 3.15 |
| Immigrants | Belgium | 0.6 /100 | #274 | Tragic 3.15 |
| Cambodians | 0.6 /100 | #275 | Tragic 3.15 |
| Immigrants | Bosnia and Herzegovina | 0.5 /100 | #276 | Tragic 3.15 |
| Swiss | 0.5 /100 | #277 | Tragic 3.15 |
| Okinawans | 0.5 /100 | #278 | Tragic 3.15 |
| Immigrants | Europe | 0.5 /100 | #279 | Tragic 3.15 |
| Immigrants | England | 0.4 /100 | #280 | Tragic 3.15 |
| Immigrants | Denmark | 0.4 /100 | #281 | Tragic 3.15 |
| Yugoslavians | 0.4 /100 | #282 | Tragic 3.15 |
| German Russians | 0.4 /100 | #283 | Tragic 3.15 |
| Immigrants | France | 0.4 /100 | #284 | Tragic 3.15 |
| Whites/Caucasians | 0.3 /100 | #285 | Tragic 3.14 |
| Immigrants | Netherlands | 0.3 /100 | #286 | Tragic 3.14 |