Polish vs Immigrants from Uzbekistan Ambulatory Disability
COMPARE
Polish
Immigrants from Uzbekistan
Ambulatory Disability
Ambulatory Disability Comparison
Poles
Immigrants from Uzbekistan
6.2%
AMBULATORY DISABILITY
26.3/ 100
METRIC RATING
197th/ 347
METRIC RANK
6.5%
AMBULATORY DISABILITY
0.6/ 100
METRIC RATING
256th/ 347
METRIC RANK
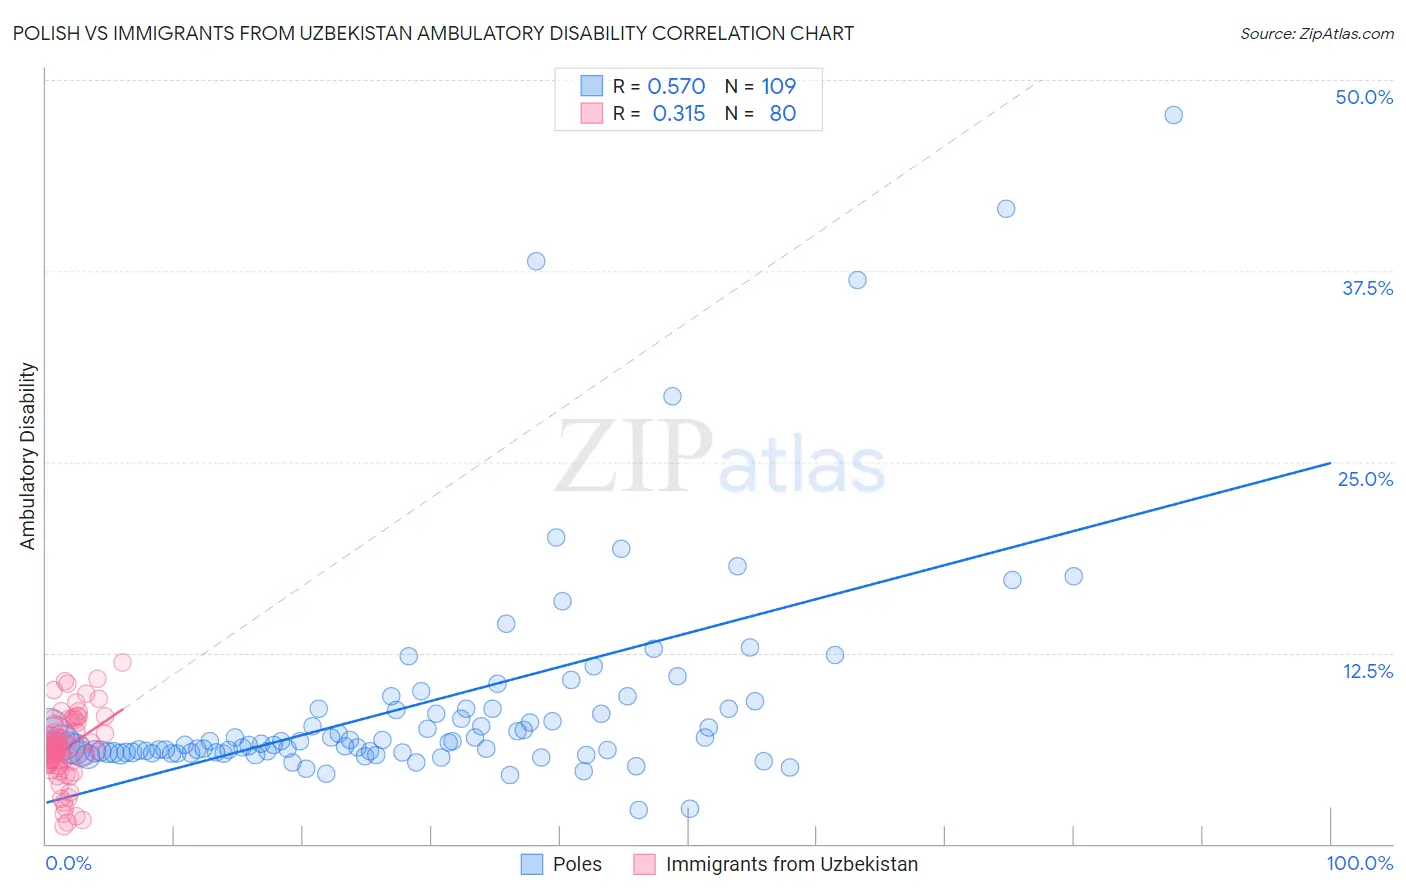
Polish vs Immigrants from Uzbekistan Ambulatory Disability Correlation Chart
The statistical analysis conducted on geographies consisting of 560,051,234 people shows a substantial positive correlation between the proportion of Poles and percentage of population with ambulatory disability in the United States with a correlation coefficient (R) of 0.570 and weighted average of 6.2%. Similarly, the statistical analysis conducted on geographies consisting of 118,661,431 people shows a mild positive correlation between the proportion of Immigrants from Uzbekistan and percentage of population with ambulatory disability in the United States with a correlation coefficient (R) of 0.315 and weighted average of 6.5%, a difference of 5.4%.
Ambulatory Disability Correlation Summary
| Measurement | Polish | Immigrants from Uzbekistan |
| Minimum | 2.2% | 1.2% |
| Maximum | 47.7% | 11.8% |
| Range | 45.5% | 10.7% |
| Mean | 9.1% | 6.2% |
| Median | 6.6% | 6.2% |
| Interquartile 25% (IQ1) | 6.0% | 5.2% |
| Interquartile 75% (IQ3) | 8.8% | 7.6% |
| Interquartile Range (IQR) | 2.8% | 2.4% |
| Standard Deviation (Sample) | 7.4% | 2.2% |
| Standard Deviation (Population) | 7.3% | 2.2% |
Similar Demographics by Ambulatory Disability
Demographics Similar to Poles by Ambulatory Disability
In terms of ambulatory disability, the demographic groups most similar to Poles are Malaysian (6.2%, a difference of 0.12%), Immigrants from Bangladesh (6.2%, a difference of 0.12%), Belgian (6.2%, a difference of 0.15%), Alaska Native (6.2%, a difference of 0.23%), and Guatemalan (6.2%, a difference of 0.24%).
| Demographics | Rating | Rank | Ambulatory Disability |
| Immigrants | Western Africa | 33.4 /100 | #190 | Fair 6.2% |
| Immigrants | Guatemala | 31.9 /100 | #191 | Fair 6.2% |
| Immigrants | Western Europe | 31.6 /100 | #192 | Fair 6.2% |
| Guatemalans | 30.0 /100 | #193 | Fair 6.2% |
| Alaska Natives | 29.8 /100 | #194 | Fair 6.2% |
| Belgians | 28.6 /100 | #195 | Fair 6.2% |
| Malaysians | 28.2 /100 | #196 | Fair 6.2% |
| Poles | 26.3 /100 | #197 | Fair 6.2% |
| Immigrants | Bangladesh | 24.6 /100 | #198 | Fair 6.2% |
| Italians | 22.6 /100 | #199 | Fair 6.2% |
| Immigrants | Cambodia | 21.5 /100 | #200 | Fair 6.2% |
| Immigrants | Central America | 20.1 /100 | #201 | Fair 6.2% |
| Albanians | 19.7 /100 | #202 | Poor 6.2% |
| Immigrants | Ukraine | 18.4 /100 | #203 | Poor 6.2% |
| Immigrants | Congo | 18.2 /100 | #204 | Poor 6.2% |
Demographics Similar to Immigrants from Uzbekistan by Ambulatory Disability
In terms of ambulatory disability, the demographic groups most similar to Immigrants from Uzbekistan are Welsh (6.5%, a difference of 0.080%), Bermudan (6.5%, a difference of 0.080%), Belizean (6.5%, a difference of 0.15%), Spanish American Indian (6.5%, a difference of 0.16%), and Scottish (6.5%, a difference of 0.30%).
| Demographics | Rating | Rank | Ambulatory Disability |
| Native Hawaiians | 1.1 /100 | #249 | Tragic 6.5% |
| Chinese | 1.0 /100 | #250 | Tragic 6.5% |
| Hawaiians | 0.9 /100 | #251 | Tragic 6.5% |
| Immigrants | Bahamas | 0.8 /100 | #252 | Tragic 6.5% |
| Scottish | 0.7 /100 | #253 | Tragic 6.5% |
| Belizeans | 0.7 /100 | #254 | Tragic 6.5% |
| Welsh | 0.6 /100 | #255 | Tragic 6.5% |
| Immigrants | Uzbekistan | 0.6 /100 | #256 | Tragic 6.5% |
| Bermudans | 0.5 /100 | #257 | Tragic 6.5% |
| Spanish American Indians | 0.5 /100 | #258 | Tragic 6.5% |
| Aleuts | 0.4 /100 | #259 | Tragic 6.6% |
| Immigrants | Belize | 0.4 /100 | #260 | Tragic 6.6% |
| Irish | 0.4 /100 | #261 | Tragic 6.6% |
| English | 0.4 /100 | #262 | Tragic 6.6% |
| Hmong | 0.3 /100 | #263 | Tragic 6.6% |