Polish vs Immigrants from Eastern Europe Ambulatory Disability
COMPARE
Polish
Immigrants from Eastern Europe
Ambulatory Disability
Ambulatory Disability Comparison
Poles
Immigrants from Eastern Europe
6.2%
AMBULATORY DISABILITY
26.3/ 100
METRIC RATING
197th/ 347
METRIC RANK
6.0%
AMBULATORY DISABILITY
82.0/ 100
METRIC RATING
148th/ 347
METRIC RANK
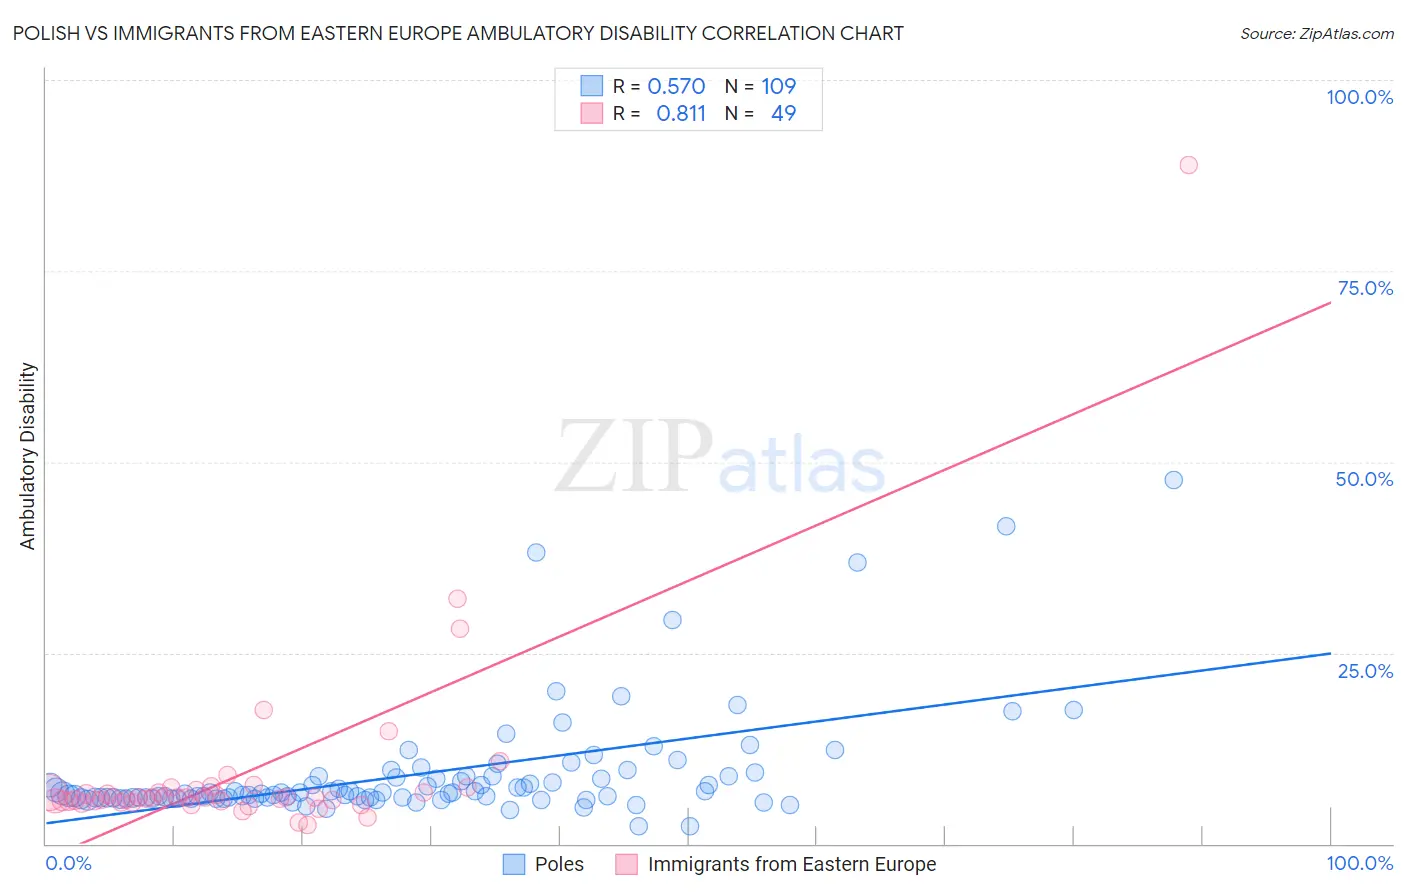
Polish vs Immigrants from Eastern Europe Ambulatory Disability Correlation Chart
The statistical analysis conducted on geographies consisting of 560,051,234 people shows a substantial positive correlation between the proportion of Poles and percentage of population with ambulatory disability in the United States with a correlation coefficient (R) of 0.570 and weighted average of 6.2%. Similarly, the statistical analysis conducted on geographies consisting of 475,636,404 people shows a very strong positive correlation between the proportion of Immigrants from Eastern Europe and percentage of population with ambulatory disability in the United States with a correlation coefficient (R) of 0.811 and weighted average of 6.0%, a difference of 3.4%.
Ambulatory Disability Correlation Summary
| Measurement | Polish | Immigrants from Eastern Europe |
| Minimum | 2.2% | 2.4% |
| Maximum | 47.7% | 88.9% |
| Range | 45.5% | 86.4% |
| Mean | 9.1% | 9.1% |
| Median | 6.6% | 6.0% |
| Interquartile 25% (IQ1) | 6.0% | 5.6% |
| Interquartile 75% (IQ3) | 8.8% | 6.9% |
| Interquartile Range (IQR) | 2.8% | 1.3% |
| Standard Deviation (Sample) | 7.4% | 12.8% |
| Standard Deviation (Population) | 7.3% | 12.7% |
Similar Demographics by Ambulatory Disability
Demographics Similar to Poles by Ambulatory Disability
In terms of ambulatory disability, the demographic groups most similar to Poles are Malaysian (6.2%, a difference of 0.12%), Immigrants from Bangladesh (6.2%, a difference of 0.12%), Belgian (6.2%, a difference of 0.15%), Alaska Native (6.2%, a difference of 0.23%), and Guatemalan (6.2%, a difference of 0.24%).
| Demographics | Rating | Rank | Ambulatory Disability |
| Immigrants | Western Africa | 33.4 /100 | #190 | Fair 6.2% |
| Immigrants | Guatemala | 31.9 /100 | #191 | Fair 6.2% |
| Immigrants | Western Europe | 31.6 /100 | #192 | Fair 6.2% |
| Guatemalans | 30.0 /100 | #193 | Fair 6.2% |
| Alaska Natives | 29.8 /100 | #194 | Fair 6.2% |
| Belgians | 28.6 /100 | #195 | Fair 6.2% |
| Malaysians | 28.2 /100 | #196 | Fair 6.2% |
| Poles | 26.3 /100 | #197 | Fair 6.2% |
| Immigrants | Bangladesh | 24.6 /100 | #198 | Fair 6.2% |
| Italians | 22.6 /100 | #199 | Fair 6.2% |
| Immigrants | Cambodia | 21.5 /100 | #200 | Fair 6.2% |
| Immigrants | Central America | 20.1 /100 | #201 | Fair 6.2% |
| Albanians | 19.7 /100 | #202 | Poor 6.2% |
| Immigrants | Ukraine | 18.4 /100 | #203 | Poor 6.2% |
| Immigrants | Congo | 18.2 /100 | #204 | Poor 6.2% |
Demographics Similar to Immigrants from Eastern Europe by Ambulatory Disability
In terms of ambulatory disability, the demographic groups most similar to Immigrants from Eastern Europe are Lithuanian (6.0%, a difference of 0.010%), Maltese (6.0%, a difference of 0.030%), Immigrants from Moldova (6.0%, a difference of 0.040%), Pakistani (6.0%, a difference of 0.050%), and Immigrants from Greece (6.0%, a difference of 0.050%).
| Demographics | Rating | Rank | Ambulatory Disability |
| Swedes | 83.1 /100 | #141 | Excellent 6.0% |
| Immigrants | Philippines | 83.0 /100 | #142 | Excellent 6.0% |
| Romanians | 82.9 /100 | #143 | Excellent 6.0% |
| Macedonians | 82.8 /100 | #144 | Excellent 6.0% |
| Pakistanis | 82.5 /100 | #145 | Excellent 6.0% |
| Immigrants | Greece | 82.5 /100 | #146 | Excellent 6.0% |
| Immigrants | Moldova | 82.4 /100 | #147 | Excellent 6.0% |
| Immigrants | Eastern Europe | 82.0 /100 | #148 | Excellent 6.0% |
| Lithuanians | 81.9 /100 | #149 | Excellent 6.0% |
| Maltese | 81.6 /100 | #150 | Excellent 6.0% |
| Greeks | 79.6 /100 | #151 | Good 6.0% |
| Immigrants | Austria | 78.8 /100 | #152 | Good 6.0% |
| Syrians | 75.5 /100 | #153 | Good 6.0% |
| Immigrants | Croatia | 75.1 /100 | #154 | Good 6.0% |
| Immigrants | Scotland | 72.1 /100 | #155 | Good 6.0% |