Nigerian vs Immigrants from Africa Disability Age Under 5
COMPARE
Nigerian
Immigrants from Africa
Disability Age Under 5
Disability Age Under 5 Comparison
Nigerians
Immigrants from Africa
1.3%
DISABILITY AGE UNDER 5
21.2/ 100
METRIC RATING
207th/ 347
METRIC RANK
1.2%
DISABILITY AGE UNDER 5
65.1/ 100
METRIC RATING
161st/ 347
METRIC RANK
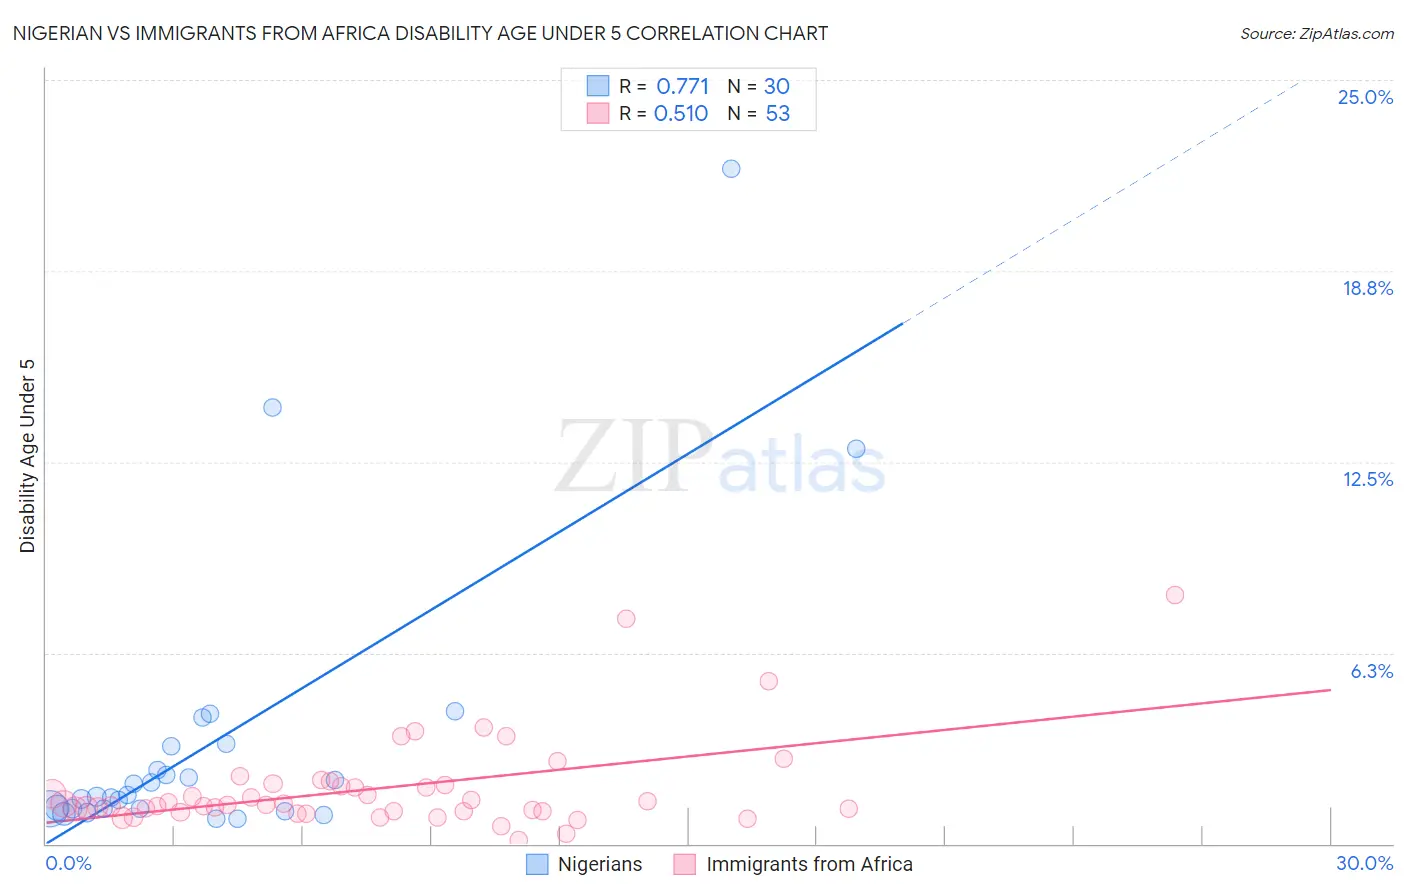
Nigerian vs Immigrants from Africa Disability Age Under 5 Correlation Chart
The statistical analysis conducted on geographies consisting of 194,464,110 people shows a strong positive correlation between the proportion of Nigerians and percentage of population with a disability under the age of 5 in the United States with a correlation coefficient (R) of 0.771 and weighted average of 1.3%. Similarly, the statistical analysis conducted on geographies consisting of 240,976,621 people shows a substantial positive correlation between the proportion of Immigrants from Africa and percentage of population with a disability under the age of 5 in the United States with a correlation coefficient (R) of 0.510 and weighted average of 1.2%, a difference of 4.4%.
Disability Age Under 5 Correlation Summary
| Measurement | Nigerian | Immigrants from Africa |
| Minimum | 0.82% | 0.10% |
| Maximum | 22.1% | 8.1% |
| Range | 21.3% | 8.0% |
| Mean | 3.3% | 1.8% |
| Median | 1.6% | 1.3% |
| Interquartile 25% (IQ1) | 1.2% | 1.1% |
| Interquartile 75% (IQ3) | 3.2% | 2.0% |
| Interquartile Range (IQR) | 2.0% | 0.89% |
| Standard Deviation (Sample) | 4.7% | 1.5% |
| Standard Deviation (Population) | 4.7% | 1.5% |
Similar Demographics by Disability Age Under 5
Demographics Similar to Nigerians by Disability Age Under 5
In terms of disability age under 5, the demographic groups most similar to Nigerians are Mexican (1.3%, a difference of 0.060%), Immigrants from Poland (1.3%, a difference of 0.15%), Romanian (1.3%, a difference of 0.17%), Bulgarian (1.3%, a difference of 0.23%), and Pakistani (1.3%, a difference of 0.24%).
| Demographics | Rating | Rank | Disability Age Under 5 |
| Immigrants | Lithuania | 27.2 /100 | #200 | Fair 1.3% |
| Immigrants | Italy | 25.4 /100 | #201 | Fair 1.3% |
| Arapaho | 24.1 /100 | #202 | Fair 1.3% |
| Liberians | 24.0 /100 | #203 | Fair 1.3% |
| Immigrants | Europe | 23.6 /100 | #204 | Fair 1.3% |
| Romanians | 22.5 /100 | #205 | Fair 1.3% |
| Immigrants | Poland | 22.4 /100 | #206 | Fair 1.3% |
| Nigerians | 21.2 /100 | #207 | Fair 1.3% |
| Mexicans | 20.8 /100 | #208 | Fair 1.3% |
| Bulgarians | 19.5 /100 | #209 | Poor 1.3% |
| Pakistanis | 19.4 /100 | #210 | Poor 1.3% |
| Immigrants | Greece | 19.1 /100 | #211 | Poor 1.3% |
| Chileans | 18.8 /100 | #212 | Poor 1.3% |
| Immigrants | Sudan | 18.7 /100 | #213 | Poor 1.3% |
| Immigrants | Chile | 17.2 /100 | #214 | Poor 1.3% |
Demographics Similar to Immigrants from Africa by Disability Age Under 5
In terms of disability age under 5, the demographic groups most similar to Immigrants from Africa are Colombian (1.2%, a difference of 0.070%), Immigrants from Latin America (1.2%, a difference of 0.070%), Arab (1.2%, a difference of 0.13%), Guatemalan (1.2%, a difference of 0.15%), and Immigrants from South America (1.2%, a difference of 0.19%).
| Demographics | Rating | Rank | Disability Age Under 5 |
| Uruguayans | 68.8 /100 | #154 | Good 1.2% |
| Immigrants | Ghana | 68.7 /100 | #155 | Good 1.2% |
| Hawaiians | 68.5 /100 | #156 | Good 1.2% |
| Immigrants | South America | 67.0 /100 | #157 | Good 1.2% |
| Arabs | 66.4 /100 | #158 | Good 1.2% |
| Colombians | 65.8 /100 | #159 | Good 1.2% |
| Immigrants | Latin America | 65.8 /100 | #160 | Good 1.2% |
| Immigrants | Africa | 65.1 /100 | #161 | Good 1.2% |
| Guatemalans | 63.6 /100 | #162 | Good 1.2% |
| Immigrants | Guatemala | 63.2 /100 | #163 | Good 1.2% |
| Laotians | 62.8 /100 | #164 | Good 1.2% |
| Immigrants | Kuwait | 62.6 /100 | #165 | Good 1.2% |
| Immigrants | Central America | 61.4 /100 | #166 | Good 1.2% |
| Immigrants | Argentina | 60.2 /100 | #167 | Good 1.2% |
| Sierra Leoneans | 59.1 /100 | #168 | Average 1.2% |