Immigrants from Germany vs Immigrants from Africa Disability Age Under 5
COMPARE
Immigrants from Germany
Immigrants from Africa
Disability Age Under 5
Disability Age Under 5 Comparison
Immigrants from Germany
Immigrants from Africa
1.4%
DISABILITY AGE UNDER 5
0.1/ 100
METRIC RATING
266th/ 347
METRIC RANK
1.2%
DISABILITY AGE UNDER 5
65.1/ 100
METRIC RATING
161st/ 347
METRIC RANK
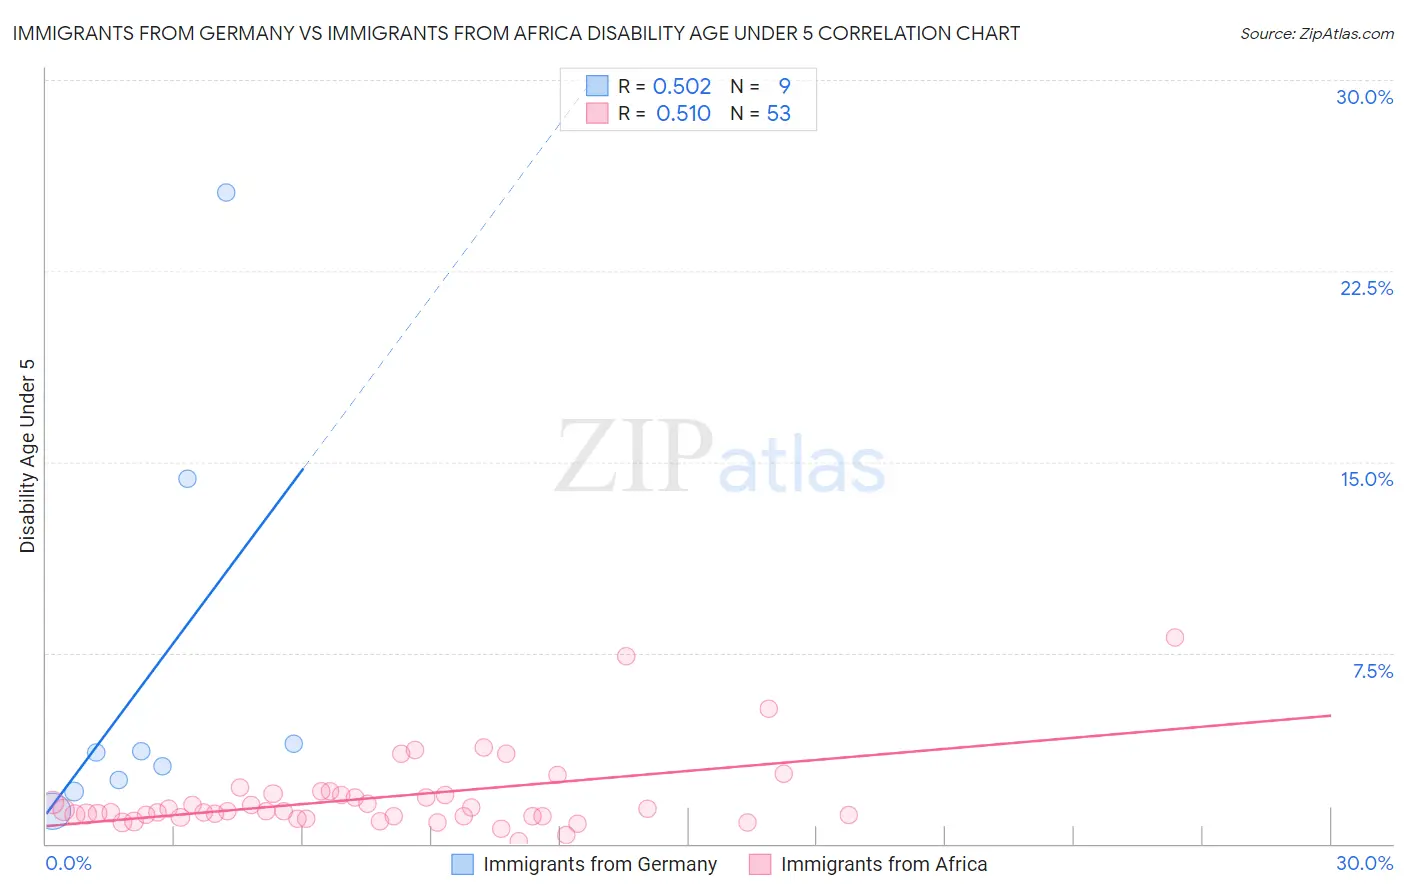
Immigrants from Germany vs Immigrants from Africa Disability Age Under 5 Correlation Chart
The statistical analysis conducted on geographies consisting of 235,379,937 people shows a substantial positive correlation between the proportion of Immigrants from Germany and percentage of population with a disability under the age of 5 in the United States with a correlation coefficient (R) of 0.502 and weighted average of 1.4%. Similarly, the statistical analysis conducted on geographies consisting of 240,976,621 people shows a substantial positive correlation between the proportion of Immigrants from Africa and percentage of population with a disability under the age of 5 in the United States with a correlation coefficient (R) of 0.510 and weighted average of 1.2%, a difference of 16.4%.
Disability Age Under 5 Correlation Summary
| Measurement | Immigrants from Germany | Immigrants from Africa |
| Minimum | 1.3% | 0.10% |
| Maximum | 25.6% | 8.1% |
| Range | 24.3% | 8.0% |
| Mean | 6.7% | 1.8% |
| Median | 3.6% | 1.3% |
| Interquartile 25% (IQ1) | 2.3% | 1.1% |
| Interquartile 75% (IQ3) | 9.1% | 2.0% |
| Interquartile Range (IQR) | 6.8% | 0.89% |
| Standard Deviation (Sample) | 8.1% | 1.5% |
| Standard Deviation (Population) | 7.6% | 1.5% |
Similar Demographics by Disability Age Under 5
Demographics Similar to Immigrants from Germany by Disability Age Under 5
In terms of disability age under 5, the demographic groups most similar to Immigrants from Germany are Carpatho Rusyn (1.4%, a difference of 0.030%), Yugoslavian (1.4%, a difference of 0.080%), Spanish (1.4%, a difference of 0.22%), Immigrants from Dominica (1.4%, a difference of 0.28%), and Immigrants from Netherlands (1.4%, a difference of 0.44%).
| Demographics | Rating | Rank | Disability Age Under 5 |
| Immigrants | Southern Europe | 0.3 /100 | #259 | Tragic 1.4% |
| Slavs | 0.3 /100 | #260 | Tragic 1.4% |
| Immigrants | Netherlands | 0.2 /100 | #261 | Tragic 1.4% |
| Immigrants | Dominica | 0.2 /100 | #262 | Tragic 1.4% |
| Spanish | 0.2 /100 | #263 | Tragic 1.4% |
| Yugoslavians | 0.1 /100 | #264 | Tragic 1.4% |
| Carpatho Rusyns | 0.1 /100 | #265 | Tragic 1.4% |
| Immigrants | Germany | 0.1 /100 | #266 | Tragic 1.4% |
| Cree | 0.1 /100 | #267 | Tragic 1.4% |
| Belgians | 0.1 /100 | #268 | Tragic 1.4% |
| Austrians | 0.1 /100 | #269 | Tragic 1.4% |
| Immigrants | North America | 0.1 /100 | #270 | Tragic 1.4% |
| Immigrants | Canada | 0.1 /100 | #271 | Tragic 1.4% |
| Blacks/African Americans | 0.1 /100 | #272 | Tragic 1.4% |
| Alaskan Athabascans | 0.1 /100 | #273 | Tragic 1.5% |
Demographics Similar to Immigrants from Africa by Disability Age Under 5
In terms of disability age under 5, the demographic groups most similar to Immigrants from Africa are Colombian (1.2%, a difference of 0.070%), Immigrants from Latin America (1.2%, a difference of 0.070%), Arab (1.2%, a difference of 0.13%), Guatemalan (1.2%, a difference of 0.15%), and Immigrants from South America (1.2%, a difference of 0.19%).
| Demographics | Rating | Rank | Disability Age Under 5 |
| Uruguayans | 68.8 /100 | #154 | Good 1.2% |
| Immigrants | Ghana | 68.7 /100 | #155 | Good 1.2% |
| Hawaiians | 68.5 /100 | #156 | Good 1.2% |
| Immigrants | South America | 67.0 /100 | #157 | Good 1.2% |
| Arabs | 66.4 /100 | #158 | Good 1.2% |
| Colombians | 65.8 /100 | #159 | Good 1.2% |
| Immigrants | Latin America | 65.8 /100 | #160 | Good 1.2% |
| Immigrants | Africa | 65.1 /100 | #161 | Good 1.2% |
| Guatemalans | 63.6 /100 | #162 | Good 1.2% |
| Immigrants | Guatemala | 63.2 /100 | #163 | Good 1.2% |
| Laotians | 62.8 /100 | #164 | Good 1.2% |
| Immigrants | Kuwait | 62.6 /100 | #165 | Good 1.2% |
| Immigrants | Central America | 61.4 /100 | #166 | Good 1.2% |
| Immigrants | Argentina | 60.2 /100 | #167 | Good 1.2% |
| Sierra Leoneans | 59.1 /100 | #168 | Average 1.2% |