Immigrants from Chile vs South American Disability Age 35 to 64
COMPARE
Immigrants from Chile
South American
Disability Age 35 to 64
Disability Age 35 to 64 Comparison
Immigrants from Chile
South Americans
10.1%
DISABILITY AGE 35 TO 64
99.4/ 100
METRIC RATING
76th/ 347
METRIC RANK
9.9%
DISABILITY AGE 35 TO 64
99.8/ 100
METRIC RATING
56th/ 347
METRIC RANK
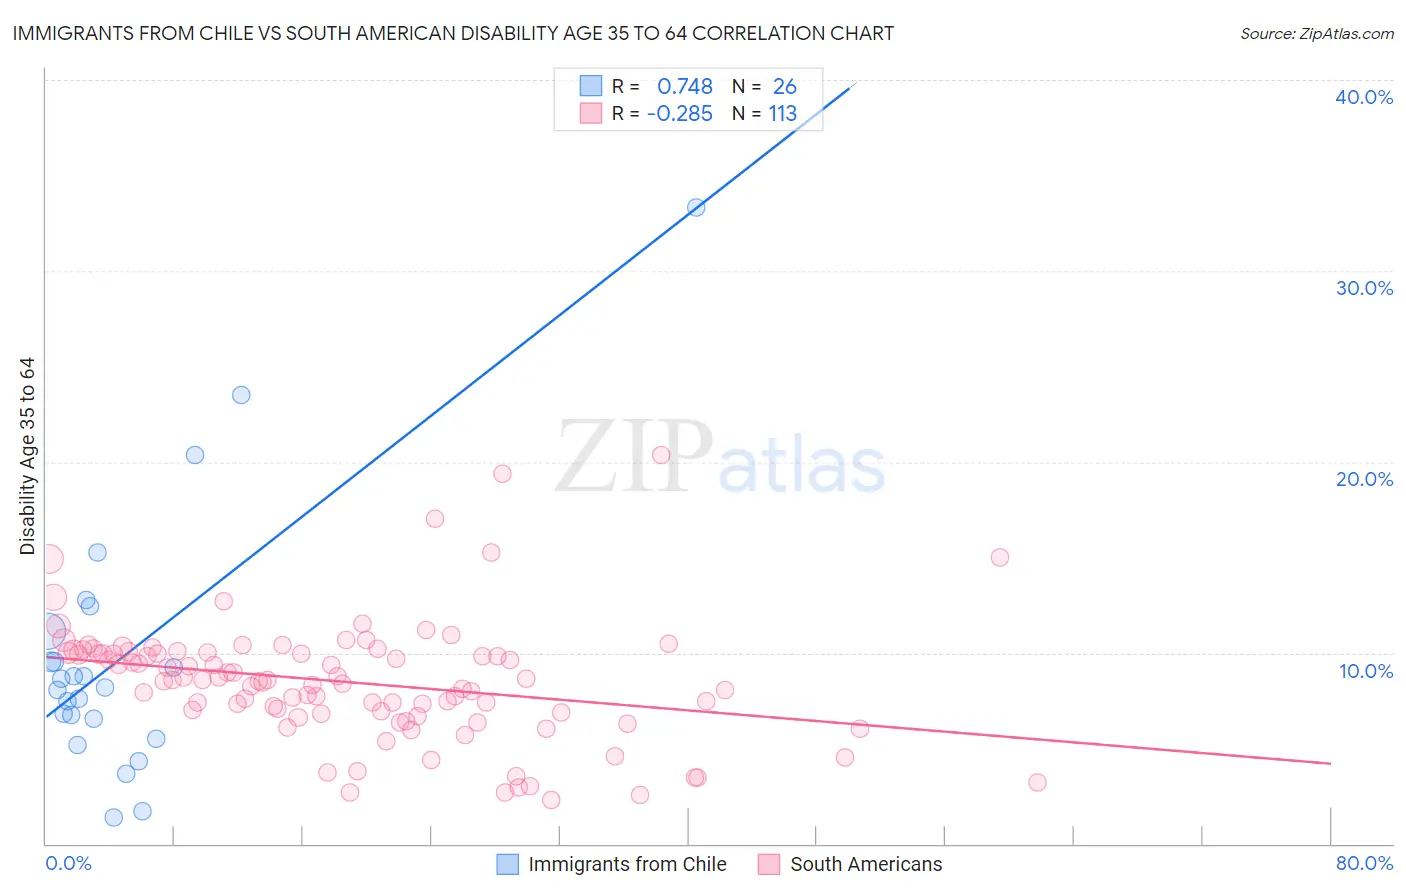
Immigrants from Chile vs South American Disability Age 35 to 64 Correlation Chart
The statistical analysis conducted on geographies consisting of 218,587,617 people shows a strong positive correlation between the proportion of Immigrants from Chile and percentage of population with a disability between the ages 34 and 64 in the United States with a correlation coefficient (R) of 0.748 and weighted average of 10.1%. Similarly, the statistical analysis conducted on geographies consisting of 493,521,440 people shows a weak negative correlation between the proportion of South Americans and percentage of population with a disability between the ages 34 and 64 in the United States with a correlation coefficient (R) of -0.285 and weighted average of 9.9%, a difference of 2.5%.
Disability Age 35 to 64 Correlation Summary
| Measurement | Immigrants from Chile | South American |
| Minimum | 1.4% | 2.3% |
| Maximum | 33.3% | 20.4% |
| Range | 32.0% | 18.1% |
| Mean | 9.9% | 8.5% |
| Median | 8.4% | 8.6% |
| Interquartile 25% (IQ1) | 6.5% | 6.8% |
| Interquartile 75% (IQ3) | 11.1% | 10.0% |
| Interquartile Range (IQR) | 4.6% | 3.2% |
| Standard Deviation (Sample) | 6.9% | 3.1% |
| Standard Deviation (Population) | 6.8% | 3.1% |
Demographics Similar to Immigrants from Chile and South Americans by Disability Age 35 to 64
In terms of disability age 35 to 64, the demographic groups most similar to Immigrants from Chile are Immigrants from Latvia (10.1%, a difference of 0.010%), Laotian (10.1%, a difference of 0.10%), Immigrants from Northern Europe (10.1%, a difference of 0.29%), Immigrants from France (10.1%, a difference of 0.29%), and Immigrants from Kazakhstan (10.1%, a difference of 0.49%). Similarly, the demographic groups most similar to South Americans are Colombian (9.9%, a difference of 0.010%), Armenian (9.9%, a difference of 0.12%), Immigrants from Sweden (9.9%, a difference of 0.42%), Immigrants from South America (9.9%, a difference of 0.63%), and Immigrants from Spain (10.0%, a difference of 0.75%).
| Demographics | Rating | Rank | Disability Age 35 to 64 |
| South Americans | 99.8 /100 | #56 | Exceptional 9.9% |
| Colombians | 99.8 /100 | #57 | Exceptional 9.9% |
| Armenians | 99.8 /100 | #58 | Exceptional 9.9% |
| Immigrants | Sweden | 99.7 /100 | #59 | Exceptional 9.9% |
| Immigrants | South America | 99.7 /100 | #60 | Exceptional 9.9% |
| Immigrants | Spain | 99.7 /100 | #61 | Exceptional 10.0% |
| Eastern Europeans | 99.7 /100 | #62 | Exceptional 10.0% |
| Immigrants | Czechoslovakia | 99.7 /100 | #63 | Exceptional 10.0% |
| Immigrants | Romania | 99.7 /100 | #64 | Exceptional 10.0% |
| Immigrants | Poland | 99.6 /100 | #65 | Exceptional 10.0% |
| Cubans | 99.6 /100 | #66 | Exceptional 10.0% |
| Immigrants | Uzbekistan | 99.5 /100 | #67 | Exceptional 10.1% |
| Immigrants | Switzerland | 99.5 /100 | #68 | Exceptional 10.1% |
| Immigrants | Eastern Europe | 99.5 /100 | #69 | Exceptional 10.1% |
| Immigrants | Nicaragua | 99.5 /100 | #70 | Exceptional 10.1% |
| Immigrants | Kazakhstan | 99.5 /100 | #71 | Exceptional 10.1% |
| Immigrants | Northern Europe | 99.5 /100 | #72 | Exceptional 10.1% |
| Immigrants | France | 99.5 /100 | #73 | Exceptional 10.1% |
| Laotians | 99.4 /100 | #74 | Exceptional 10.1% |
| Immigrants | Latvia | 99.4 /100 | #75 | Exceptional 10.1% |
| Immigrants | Chile | 99.4 /100 | #76 | Exceptional 10.1% |