Pima vs Immigrants from Western Europe Disability Age 35 to 64
COMPARE
Pima
Immigrants from Western Europe
Disability Age 35 to 64
Disability Age 35 to 64 Comparison
Pima
Immigrants from Western Europe
16.1%
DISABILITY AGE 35 TO 64
0.0/ 100
METRIC RATING
339th/ 347
METRIC RANK
11.1%
DISABILITY AGE 35 TO 64
65.2/ 100
METRIC RATING
165th/ 347
METRIC RANK
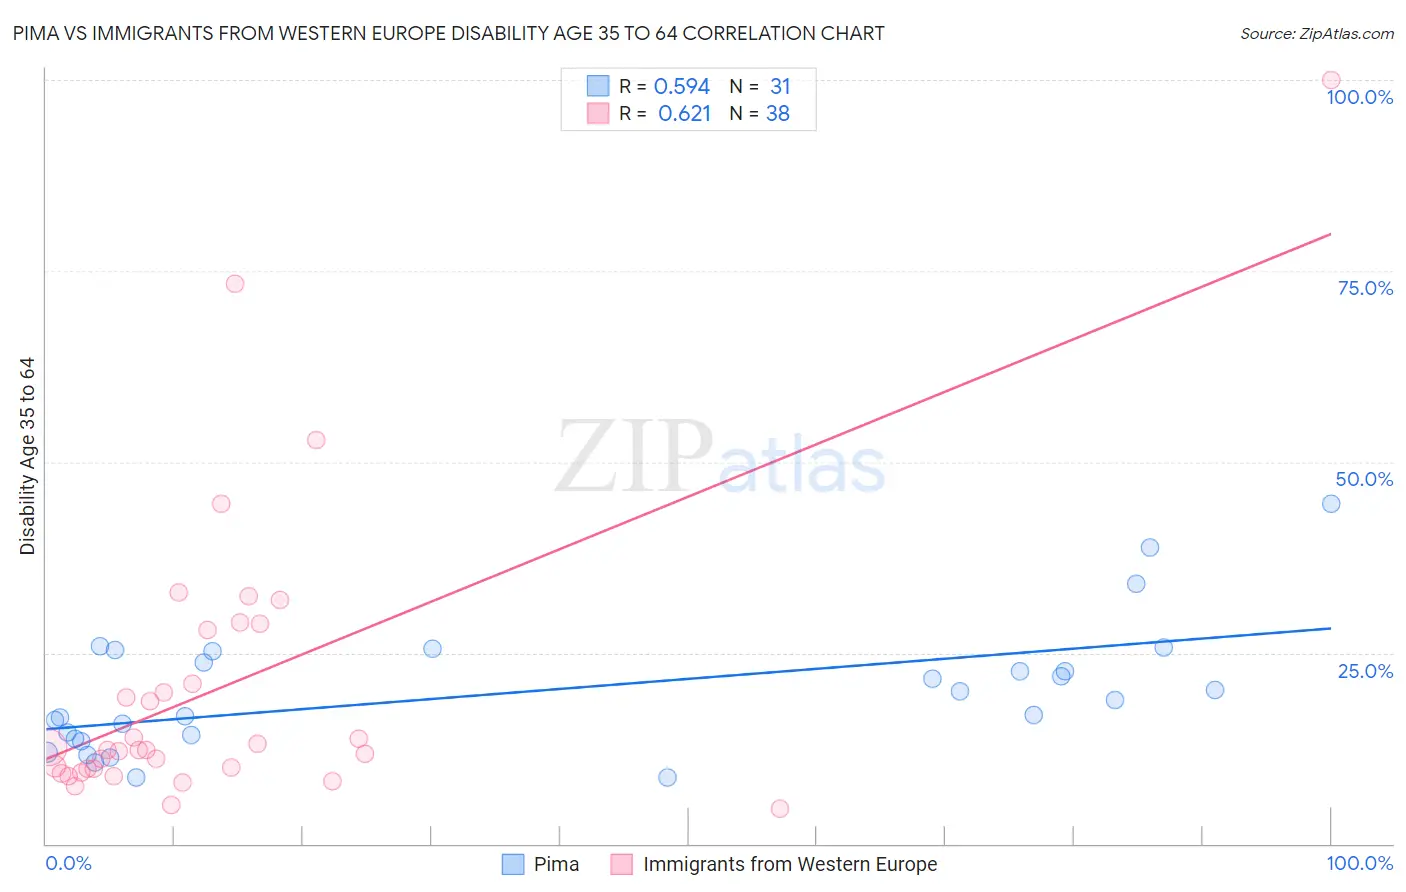
Pima vs Immigrants from Western Europe Disability Age 35 to 64 Correlation Chart
The statistical analysis conducted on geographies consisting of 61,540,994 people shows a substantial positive correlation between the proportion of Pima and percentage of population with a disability between the ages 34 and 64 in the United States with a correlation coefficient (R) of 0.594 and weighted average of 16.1%. Similarly, the statistical analysis conducted on geographies consisting of 493,692,724 people shows a significant positive correlation between the proportion of Immigrants from Western Europe and percentage of population with a disability between the ages 34 and 64 in the United States with a correlation coefficient (R) of 0.621 and weighted average of 11.1%, a difference of 45.0%.
Disability Age 35 to 64 Correlation Summary
| Measurement | Pima | Immigrants from Western Europe |
| Minimum | 8.6% | 4.6% |
| Maximum | 44.5% | 100.0% |
| Range | 35.9% | 95.4% |
| Mean | 19.9% | 20.5% |
| Median | 18.9% | 12.3% |
| Interquartile 25% (IQ1) | 13.8% | 9.8% |
| Interquartile 75% (IQ3) | 25.1% | 27.9% |
| Interquartile Range (IQR) | 11.3% | 18.1% |
| Standard Deviation (Sample) | 8.4% | 19.5% |
| Standard Deviation (Population) | 8.2% | 19.2% |
Similar Demographics by Disability Age 35 to 64
Demographics Similar to Pima by Disability Age 35 to 64
In terms of disability age 35 to 64, the demographic groups most similar to Pima are Chickasaw (16.1%, a difference of 0.20%), Puerto Rican (15.9%, a difference of 1.2%), Menominee (15.9%, a difference of 1.6%), Choctaw (16.4%, a difference of 1.7%), and Seminole (15.9%, a difference of 1.8%).
| Demographics | Rating | Rank | Disability Age 35 to 64 |
| Alaskan Athabascans | 0.0 /100 | #332 | Tragic 15.7% |
| Yuman | 0.0 /100 | #333 | Tragic 15.8% |
| Colville | 0.0 /100 | #334 | Tragic 15.8% |
| Seminole | 0.0 /100 | #335 | Tragic 15.9% |
| Menominee | 0.0 /100 | #336 | Tragic 15.9% |
| Puerto Ricans | 0.0 /100 | #337 | Tragic 15.9% |
| Chickasaw | 0.0 /100 | #338 | Tragic 16.1% |
| Pima | 0.0 /100 | #339 | Tragic 16.1% |
| Choctaw | 0.0 /100 | #340 | Tragic 16.4% |
| Tsimshian | 0.0 /100 | #341 | Tragic 16.7% |
| Tohono O'odham | 0.0 /100 | #342 | Tragic 16.7% |
| Creek | 0.0 /100 | #343 | Tragic 16.9% |
| Yup'ik | 0.0 /100 | #344 | Tragic 16.9% |
| Kiowa | 0.0 /100 | #345 | Tragic 17.4% |
| Lumbee | 0.0 /100 | #346 | Tragic 17.6% |
Demographics Similar to Immigrants from Western Europe by Disability Age 35 to 64
In terms of disability age 35 to 64, the demographic groups most similar to Immigrants from Western Europe are Pakistani (11.1%, a difference of 0.050%), Immigrants from Haiti (11.1%, a difference of 0.12%), Immigrants from St. Vincent and the Grenadines (11.1%, a difference of 0.13%), Austrian (11.1%, a difference of 0.17%), and Immigrants from Grenada (11.1%, a difference of 0.29%).
| Demographics | Rating | Rank | Disability Age 35 to 64 |
| Immigrants | North America | 74.9 /100 | #158 | Good 11.0% |
| Serbians | 73.6 /100 | #159 | Good 11.0% |
| Croatians | 73.1 /100 | #160 | Good 11.0% |
| Immigrants | Guyana | 70.1 /100 | #161 | Good 11.1% |
| Immigrants | Grenada | 68.4 /100 | #162 | Good 11.1% |
| Immigrants | St. Vincent and the Grenadines | 66.6 /100 | #163 | Good 11.1% |
| Pakistanis | 65.8 /100 | #164 | Good 11.1% |
| Immigrants | Western Europe | 65.2 /100 | #165 | Good 11.1% |
| Immigrants | Haiti | 63.8 /100 | #166 | Good 11.1% |
| Austrians | 63.2 /100 | #167 | Good 11.1% |
| Central Americans | 59.1 /100 | #168 | Average 11.2% |
| Haitians | 59.0 /100 | #169 | Average 11.2% |
| Immigrants | Uganda | 58.0 /100 | #170 | Average 11.2% |
| Immigrants | Trinidad and Tobago | 55.9 /100 | #171 | Average 11.2% |
| Italians | 55.6 /100 | #172 | Average 11.2% |