Immigrants from Caribbean vs South American Disability Age 35 to 64
COMPARE
Immigrants from Caribbean
South American
Disability Age 35 to 64
Disability Age 35 to 64 Comparison
Immigrants from Caribbean
South Americans
11.3%
DISABILITY AGE 35 TO 64
41.5/ 100
METRIC RATING
180th/ 347
METRIC RANK
9.9%
DISABILITY AGE 35 TO 64
99.8/ 100
METRIC RATING
56th/ 347
METRIC RANK
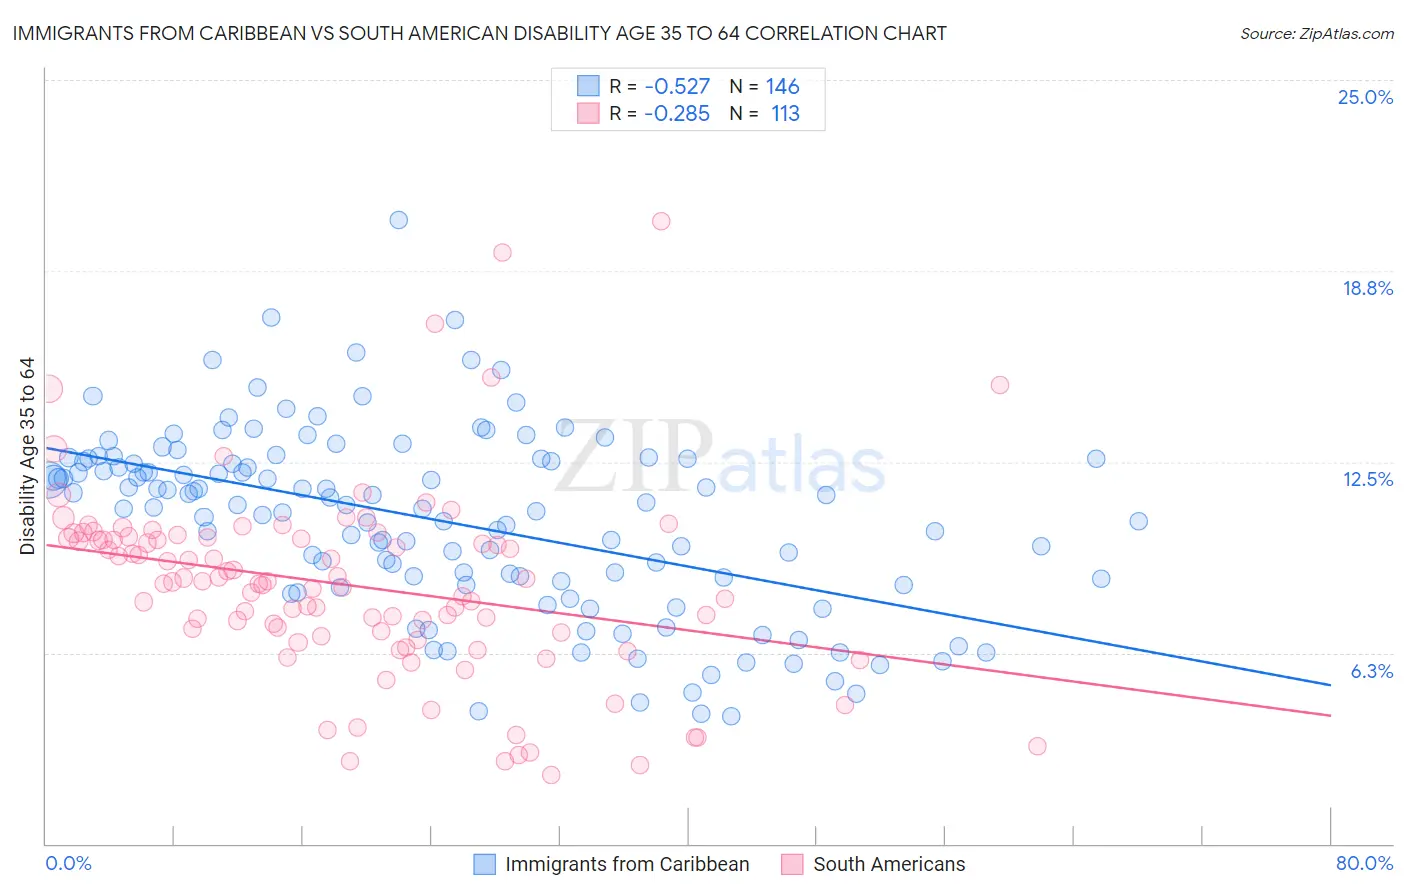
Immigrants from Caribbean vs South American Disability Age 35 to 64 Correlation Chart
The statistical analysis conducted on geographies consisting of 449,599,951 people shows a substantial negative correlation between the proportion of Immigrants from Caribbean and percentage of population with a disability between the ages 34 and 64 in the United States with a correlation coefficient (R) of -0.527 and weighted average of 11.3%. Similarly, the statistical analysis conducted on geographies consisting of 493,521,440 people shows a weak negative correlation between the proportion of South Americans and percentage of population with a disability between the ages 34 and 64 in the United States with a correlation coefficient (R) of -0.285 and weighted average of 9.9%, a difference of 14.9%.
Disability Age 35 to 64 Correlation Summary
| Measurement | Immigrants from Caribbean | South American |
| Minimum | 4.2% | 2.3% |
| Maximum | 20.4% | 20.4% |
| Range | 16.2% | 18.1% |
| Mean | 10.6% | 8.5% |
| Median | 11.1% | 8.6% |
| Interquartile 25% (IQ1) | 8.6% | 6.8% |
| Interquartile 75% (IQ3) | 12.6% | 10.0% |
| Interquartile Range (IQR) | 4.0% | 3.2% |
| Standard Deviation (Sample) | 3.0% | 3.1% |
| Standard Deviation (Population) | 3.0% | 3.1% |
Similar Demographics by Disability Age 35 to 64
Demographics Similar to Immigrants from Caribbean by Disability Age 35 to 64
In terms of disability age 35 to 64, the demographic groups most similar to Immigrants from Caribbean are Immigrants from Barbados (11.3%, a difference of 0.0%), Polish (11.3%, a difference of 0.040%), Immigrants from Eastern Africa (11.3%, a difference of 0.060%), Trinidadian and Tobagonian (11.4%, a difference of 0.060%), and Icelander (11.4%, a difference of 0.15%).
| Demographics | Rating | Rank | Disability Age 35 to 64 |
| Lebanese | 51.8 /100 | #173 | Average 11.3% |
| Immigrants | Fiji | 50.0 /100 | #174 | Average 11.3% |
| Czechs | 47.9 /100 | #175 | Average 11.3% |
| Ugandans | 43.7 /100 | #176 | Average 11.3% |
| Immigrants | Eastern Africa | 42.2 /100 | #177 | Average 11.3% |
| Poles | 42.0 /100 | #178 | Average 11.3% |
| Immigrants | Barbados | 41.6 /100 | #179 | Average 11.3% |
| Immigrants | Caribbean | 41.5 /100 | #180 | Average 11.3% |
| Trinidadians and Tobagonians | 40.8 /100 | #181 | Average 11.4% |
| Icelanders | 39.7 /100 | #182 | Fair 11.4% |
| Immigrants | Oceania | 39.5 /100 | #183 | Fair 11.4% |
| Kenyans | 39.2 /100 | #184 | Fair 11.4% |
| Danes | 36.8 /100 | #185 | Fair 11.4% |
| Slovenes | 36.6 /100 | #186 | Fair 11.4% |
| Immigrants | Bosnia and Herzegovina | 35.2 /100 | #187 | Fair 11.4% |
Demographics Similar to South Americans by Disability Age 35 to 64
In terms of disability age 35 to 64, the demographic groups most similar to South Americans are Colombian (9.9%, a difference of 0.010%), Armenian (9.9%, a difference of 0.12%), Peruvian (9.9%, a difference of 0.22%), Immigrants from Russia (9.8%, a difference of 0.29%), and Taiwanese (9.8%, a difference of 0.32%).
| Demographics | Rating | Rank | Disability Age 35 to 64 |
| Immigrants | Greece | 99.8 /100 | #49 | Exceptional 9.8% |
| Paraguayans | 99.8 /100 | #50 | Exceptional 9.8% |
| Bhutanese | 99.8 /100 | #51 | Exceptional 9.8% |
| Immigrants | Bulgaria | 99.8 /100 | #52 | Exceptional 9.8% |
| Taiwanese | 99.8 /100 | #53 | Exceptional 9.8% |
| Immigrants | Russia | 99.8 /100 | #54 | Exceptional 9.8% |
| Peruvians | 99.8 /100 | #55 | Exceptional 9.9% |
| South Americans | 99.8 /100 | #56 | Exceptional 9.9% |
| Colombians | 99.8 /100 | #57 | Exceptional 9.9% |
| Armenians | 99.8 /100 | #58 | Exceptional 9.9% |
| Immigrants | Sweden | 99.7 /100 | #59 | Exceptional 9.9% |
| Immigrants | South America | 99.7 /100 | #60 | Exceptional 9.9% |
| Immigrants | Spain | 99.7 /100 | #61 | Exceptional 10.0% |
| Eastern Europeans | 99.7 /100 | #62 | Exceptional 10.0% |
| Immigrants | Czechoslovakia | 99.7 /100 | #63 | Exceptional 10.0% |