Asian vs Immigrants from Belize Male Disability
COMPARE
Asian
Immigrants from Belize
Male Disability
Male Disability Comparison
Asians
Immigrants from Belize
10.0%
MALE DISABILITY
100.0/ 100
METRIC RATING
20th/ 347
METRIC RANK
11.3%
MALE DISABILITY
33.7/ 100
METRIC RATING
182nd/ 347
METRIC RANK
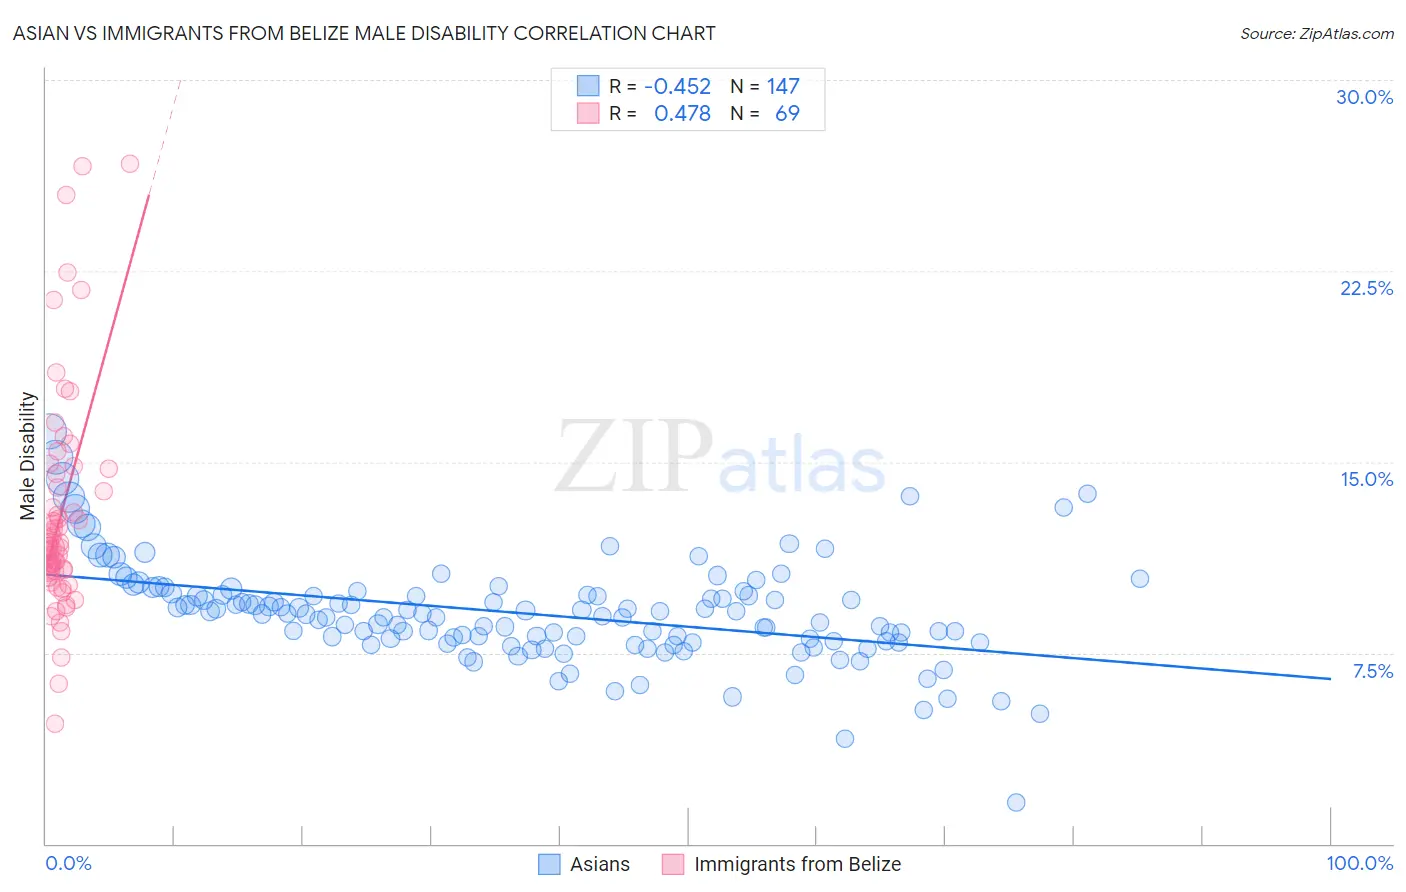
Asian vs Immigrants from Belize Male Disability Correlation Chart
The statistical analysis conducted on geographies consisting of 550,680,295 people shows a moderate negative correlation between the proportion of Asians and percentage of males with a disability in the United States with a correlation coefficient (R) of -0.452 and weighted average of 10.0%. Similarly, the statistical analysis conducted on geographies consisting of 130,304,028 people shows a moderate positive correlation between the proportion of Immigrants from Belize and percentage of males with a disability in the United States with a correlation coefficient (R) of 0.478 and weighted average of 11.3%, a difference of 13.6%.
Male Disability Correlation Summary
| Measurement | Asian | Immigrants from Belize |
| Minimum | 1.6% | 4.7% |
| Maximum | 16.2% | 26.7% |
| Range | 14.6% | 22.0% |
| Mean | 9.0% | 12.9% |
| Median | 9.0% | 11.7% |
| Interquartile 25% (IQ1) | 7.9% | 10.6% |
| Interquartile 75% (IQ3) | 9.8% | 14.3% |
| Interquartile Range (IQR) | 1.8% | 3.7% |
| Standard Deviation (Sample) | 2.0% | 4.3% |
| Standard Deviation (Population) | 2.0% | 4.3% |
Similar Demographics by Male Disability
Demographics Similar to Asians by Male Disability
In terms of male disability, the demographic groups most similar to Asians are Immigrants from Sri Lanka (10.0%, a difference of 0.060%), Burmese (10.0%, a difference of 0.11%), Immigrants from Venezuela (10.0%, a difference of 0.39%), Cypriot (10.0%, a difference of 0.49%), and Immigrants from Asia (10.0%, a difference of 0.62%).
| Demographics | Rating | Rank | Male Disability |
| Iranians | 100.0 /100 | #13 | Exceptional 9.7% |
| Immigrants | Iran | 100.0 /100 | #14 | Exceptional 9.7% |
| Indians (Asian) | 100.0 /100 | #15 | Exceptional 9.7% |
| Okinawans | 100.0 /100 | #16 | Exceptional 9.8% |
| Immigrants | Korea | 100.0 /100 | #17 | Exceptional 9.8% |
| Immigrants | Pakistan | 100.0 /100 | #18 | Exceptional 9.8% |
| Immigrants | Sri Lanka | 100.0 /100 | #19 | Exceptional 10.0% |
| Asians | 100.0 /100 | #20 | Exceptional 10.0% |
| Burmese | 100.0 /100 | #21 | Exceptional 10.0% |
| Immigrants | Venezuela | 100.0 /100 | #22 | Exceptional 10.0% |
| Cypriots | 100.0 /100 | #23 | Exceptional 10.0% |
| Immigrants | Asia | 100.0 /100 | #24 | Exceptional 10.0% |
| Immigrants | Malaysia | 99.9 /100 | #25 | Exceptional 10.0% |
| Paraguayans | 99.9 /100 | #26 | Exceptional 10.1% |
| Egyptians | 99.9 /100 | #27 | Exceptional 10.1% |
Demographics Similar to Immigrants from Belize by Male Disability
In terms of male disability, the demographic groups most similar to Immigrants from Belize are Immigrants from Senegal (11.3%, a difference of 0.040%), Immigrants from Central America (11.3%, a difference of 0.050%), Iraqi (11.3%, a difference of 0.20%), Pakistani (11.3%, a difference of 0.21%), and Immigrants from Zaire (11.4%, a difference of 0.39%).
| Demographics | Rating | Rank | Male Disability |
| Immigrants | Honduras | 48.7 /100 | #175 | Average 11.2% |
| Syrians | 46.6 /100 | #176 | Average 11.2% |
| Immigrants | Norway | 44.2 /100 | #177 | Average 11.3% |
| Australians | 42.2 /100 | #178 | Average 11.3% |
| Immigrants | Caribbean | 41.4 /100 | #179 | Average 11.3% |
| Hondurans | 41.1 /100 | #180 | Average 11.3% |
| Immigrants | Senegal | 34.4 /100 | #181 | Fair 11.3% |
| Immigrants | Belize | 33.7 /100 | #182 | Fair 11.3% |
| Immigrants | Central America | 32.9 /100 | #183 | Fair 11.3% |
| Iraqis | 30.5 /100 | #184 | Fair 11.3% |
| Pakistanis | 30.3 /100 | #185 | Fair 11.3% |
| Immigrants | Zaire | 27.6 /100 | #186 | Fair 11.4% |
| Immigrants | Austria | 27.3 /100 | #187 | Fair 11.4% |
| Estonians | 26.8 /100 | #188 | Fair 11.4% |
| Immigrants | Netherlands | 25.9 /100 | #189 | Fair 11.4% |