Peruvian vs Immigrants from Belize In Labor Force | Age 35-44

COMPARE

Peruvian
Race
Ancestry
AfghanAfricanAlaska NativeAlaskan AthabascanAlbanianAleutAlsatianAmericanApacheArabArapahoArgentineanArmenianAssyrian/Chaldean/SyriacAustralianAustrianBahamianBangladeshiBarbadianBasqueBelgianBelizeanBermudanBhutaneseBlackfeetBolivianBrazilianBritishBritish West IndianBulgarianBurmeseCajunCambodianCanadianCape VerdeanCarpatho RusynCelticCentral AmericanCentral American IndianCherokeeCheyenneChickasawChileanChineseChippewaChoctawColombianColvilleComancheCosta RicanCreeCreekCroatianCrowCubanCypriotCzechCzechoslovakianDanishDelawareDominicanDutchDutch West IndianEastern EuropeanEcuadorianEgyptianEnglishEstonianEthiopianEuropeanFijianFilipinoFinnishFrenchFrench American IndianFrench CanadianGermanGerman RussianGhanaianGreekGuamanian/ChamorroGuatemalanGuyaneseHaitianHmongHonduranHopiHoumaHungarianIcelanderIndian (Asian)IndonesianInupiatIranianIraqiIrishIroquoisIsraeliItalianJamaicanJapaneseJordanianKenyanKiowaKoreanLaotianLatvianLebaneseLiberianLithuanianLumbeeLuxembourgerMacedonianMalaysianMalteseMarshalleseMenomineeMexicanMexican American IndianMongolianMoroccanNative HawaiianNavajoNepaleseNew ZealanderNicaraguanNigerianNorthern EuropeanNorwegianOkinawanOsageOttawaPaiutePakistaniPalestinianPanamanianParaguayanPennsylvania GermanPeruvianPimaPolishPortuguesePotawatomiPuebloPuerto RicanPuget Sound SalishRomanianRussianSalvadoranSamoanScandinavianScotch-IrishScottishSeminoleSenegaleseSerbianShoshoneSierra LeoneanSiouxSlavicSlovakSloveneSomaliSouth AfricanSouth AmericanSouth American IndianSoviet UnionSpaniardSpanishSpanish AmericanSpanish American IndianSri LankanSubsaharan AfricanSudaneseSwedishSwissSyrianTaiwaneseThaiTlingit-HaidaTohono O'OdhamTonganTrinidadian and TobagonianTsimshianTurkishU.S. Virgin IslanderUgandanUkrainianUruguayanUteVenezuelanVietnameseWelshWest IndianYakamaYaquiYugoslavianYumanYup'ikZimbabwean
Immigration
NonimmigrantsImmigrantsAfghanistanAfricaAlbaniaArgentinaArmeniaAsiaAustraliaAustriaBahamasBangladeshBarbadosBelarusBelgiumBoliviaBosnia and HerzegovinaBrazilBulgariaBurma/MyanmarCabo VerdeCambodiaCameroonCanadaCaribbeanCentral AmericaChileChinaColombiaCongoCosta RicaCroatiaCubaCzechoslovakiaDenmarkDominicaDominican RepublicEastern AfricaEastern AsiaEastern EuropeEcuadorEgyptEl SalvadorEnglandEritreaEthiopiaEuropeFijiFranceGermanyGhanaGreeceGrenadaGuatemalaGuyanaHaitiHondurasHong KongHungaryIndiaIndonesiaIranIraqIrelandIsraelItalyJamaicaJapanJordanKazakhstanKenyaKoreaKuwaitLaosLatin AmericaLatviaLebanonLiberiaLithuaniaMalaysiaMexicoMicronesiaMiddle AfricaMoldovaMoroccoNepalNetherlandsNicaraguaNigeriaNorth AmericaNorth MacedoniaNorthern AfricaNorthern EuropeNorwayOceaniaPakistanPanamaPeruPhilippinesPolandPortugalRomaniaRussiaSaudi ArabiaScotlandSenegalSerbiaSierra LeoneSingaporeSomaliaSouth AfricaSouth AmericaSouth Central AsiaSouth Eastern AsiaSouthern EuropeSpainSri LankaSt. Vincent and the GrenadinesSudanSwedenSwitzerlandSyriaTaiwanThailandTrinidad and TobagoTurkeyUgandaUkraineUruguayUzbekistanVenezuelaVietnamWest IndiesWestern AfricaWestern AsiaWestern EuropeYemenZaireZimbabweAzores
Immigrants from Belize
Race
Ancestry
AfghanAfricanAlaska NativeAlaskan AthabascanAlbanianAleutAlsatianAmericanApacheArabArapahoArgentineanArmenianAssyrian/Chaldean/SyriacAustralianAustrianBahamianBangladeshiBarbadianBasqueBelgianBelizeanBermudanBhutaneseBlackfeetBolivianBrazilianBritishBritish West IndianBulgarianBurmeseCajunCambodianCanadianCape VerdeanCarpatho RusynCelticCentral AmericanCentral American IndianCherokeeCheyenneChickasawChileanChineseChippewaChoctawColombianColvilleComancheCosta RicanCreeCreekCroatianCrowCubanCypriotCzechCzechoslovakianDanishDelawareDominicanDutchDutch West IndianEastern EuropeanEcuadorianEgyptianEnglishEstonianEthiopianEuropeanFijianFilipinoFinnishFrenchFrench American IndianFrench CanadianGermanGerman RussianGhanaianGreekGuamanian/ChamorroGuatemalanGuyaneseHaitianHmongHonduranHopiHoumaHungarianIcelanderIndian (Asian)IndonesianInupiatIranianIraqiIrishIroquoisIsraeliItalianJamaicanJapaneseJordanianKenyanKiowaKoreanLaotianLatvianLebaneseLiberianLithuanianLumbeeLuxembourgerMacedonianMalaysianMalteseMarshalleseMenomineeMexicanMexican American IndianMongolianMoroccanNative HawaiianNavajoNepaleseNew ZealanderNicaraguanNigerianNorthern EuropeanNorwegianOkinawanOsageOttawaPaiutePakistaniPalestinianPanamanianParaguayanPennsylvania GermanPimaPolishPortuguesePotawatomiPuebloPuerto RicanPuget Sound SalishRomanianRussianSalvadoranSamoanScandinavianScotch-IrishScottishSeminoleSenegaleseSerbianShoshoneSierra LeoneanSiouxSlavicSlovakSloveneSomaliSouth AfricanSouth AmericanSouth American IndianSoviet UnionSpaniardSpanishSpanish AmericanSpanish American IndianSri LankanSubsaharan AfricanSudaneseSwedishSwissSyrianTaiwaneseThaiTlingit-HaidaTohono O'OdhamTonganTrinidadian and TobagonianTsimshianTurkishU.S. Virgin IslanderUgandanUkrainianUruguayanUteVenezuelanVietnameseWelshWest IndianYakamaYaquiYugoslavianYumanYup'ikZimbabwean
Immigration
NonimmigrantsImmigrantsAfghanistanAfricaAlbaniaArgentinaArmeniaAsiaAustraliaAustriaBahamasBangladeshBarbadosBelarusBelgiumBelizeBoliviaBosnia and HerzegovinaBrazilBulgariaBurma/MyanmarCabo VerdeCambodiaCameroonCanadaCaribbeanCentral AmericaChileChinaColombiaCongoCosta RicaCroatiaCubaCzechoslovakiaDenmarkDominicaDominican RepublicEastern AfricaEastern AsiaEastern EuropeEcuadorEgyptEl SalvadorEnglandEritreaEthiopiaEuropeFijiFranceGermanyGhanaGreeceGrenadaGuatemalaGuyanaHaitiHondurasHong KongHungaryIndiaIndonesiaIranIraqIrelandIsraelItalyJamaicaJapanJordanKazakhstanKenyaKoreaKuwaitLaosLatin AmericaLatviaLebanonLiberiaLithuaniaMalaysiaMexicoMicronesiaMiddle AfricaMoldovaMoroccoNepalNetherlandsNicaraguaNigeriaNorth AmericaNorth MacedoniaNorthern AfricaNorthern EuropeNorwayOceaniaPakistanPanamaPeruPhilippinesPolandPortugalRomaniaRussiaSaudi ArabiaScotlandSenegalSerbiaSierra LeoneSingaporeSomaliaSouth AfricaSouth AmericaSouth Central AsiaSouth Eastern AsiaSouthern EuropeSpainSri LankaSt. Vincent and the GrenadinesSudanSwedenSwitzerlandSyriaTaiwanThailandTrinidad and TobagoTurkeyUgandaUkraineUruguayUzbekistanVenezuelaVietnamWest IndiesWestern AfricaWestern AsiaWestern EuropeYemenZaireZimbabweAzores
In Labor Force | Age 35-44
Income
Poverty
Unemployment
Labor Participation
Family Structure
Vehicle Availability
Education Level
Disability

In Labor Force | Age 35-44 Comparison

Peruvians

Immigrants from Belize

Exceptional
Tragic
84.9%
IN LABOR FORCE | AGE 35-44
98.3/ 100
METRIC RATING
79th/ 347
METRIC RANK
82.9%
IN LABOR FORCE | AGE 35-44
0.0/ 100
METRIC RATING
287th/ 347
METRIC RANK

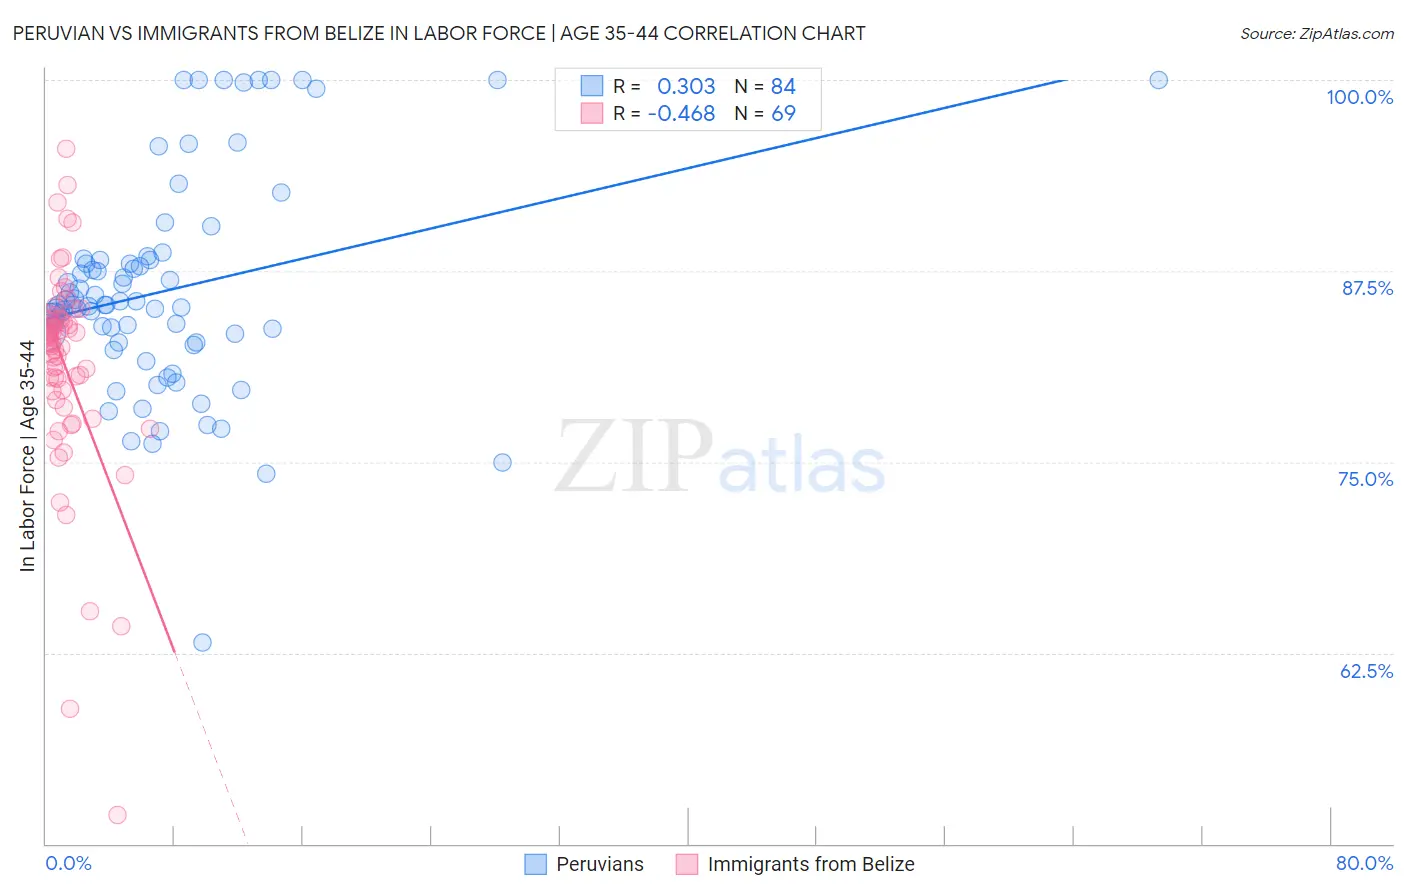
Peruvian vs Immigrants from Belize In Labor Force | Age 35-44 Correlation Chart

The statistical analysis conducted on geographies consisting of 363,043,294 people shows a mild positive correlation between the proportion of Peruvians and labor force participation rate among population between the ages 35 and 44 in the United States with a correlation coefficient (R) of 0.303 and weighted average of 84.9%. Similarly, the statistical analysis conducted on geographies consisting of 130,306,944 people shows a moderate negative correlation between the proportion of Immigrants from Belize and labor force participation rate among population between the ages 35 and 44 in the United States with a correlation coefficient (R) of -0.468 and weighted average of 82.9%, a difference of 2.4%.
Peruvian vs Immigrants from Belize In Labor Force | Age 35-44

In Labor Force | Age 35-44 Correlation Summary

MeasurementPeruvianImmigrants from Belize
Minimum63.1%51.9%
Maximum100.0%95.5%
Range36.9%43.6%
Mean86.2%81.3%
Median85.3%82.8%
Interquartile 25% (IQ1)82.8%79.3%
Interquartile 75% (IQ3)88.2%84.4%
Interquartile Range (IQR)5.4%5.1%
Standard Deviation (Sample)7.0%7.0%
Standard Deviation (Population)7.0%7.0%

Similar Demographics by In Labor Force | Age 35-44

Demographics Similar to Peruvians by In Labor Force | Age 35-44

In terms of in labor force | age 35-44, the demographic groups most similar to Peruvians are Immigrants from Africa (84.9%, a difference of 0.0%), Immigrants from Colombia (84.9%, a difference of 0.0%), Immigrants from Eastern Europe (84.9%, a difference of 0.0%), Immigrants from Sudan (84.9%, a difference of 0.020%), and Immigrants from Cuba (84.9%, a difference of 0.030%).
DemographicsRating | RankIn Labor Force | Age 35-44
Immigrants | Singapore
98.9
/100
|
#72
Exceptional
85.0%
Immigrants | Sri Lanka
98.9
/100
|
#73
Exceptional
85.0%
Colombians
98.8
/100
|
#74
Exceptional
85.0%
Immigrants | South Central Asia
98.7
/100
|
#75
Exceptional
85.0%
Immigrants | Cuba
98.6
/100
|
#76
Exceptional
84.9%
Immigrants | Turkey
98.6
/100
|
#77
Exceptional
84.9%
Immigrants | Africa
98.4
/100
|
#78
Exceptional
84.9%
Peruvians
98.3
/100
|
#79
Exceptional
84.9%
Immigrants | Colombia
98.3
/100
|
#80
Exceptional
84.9%
Immigrants | Eastern Europe
98.3
/100
|
#81
Exceptional
84.9%
Immigrants | Sudan
98.1
/100
|
#82
Exceptional
84.9%
Senegalese
97.8
/100
|
#83
Exceptional
84.9%
Immigrants | Peru
97.8
/100
|
#84
Exceptional
84.9%
Immigrants | Middle Africa
97.8
/100
|
#85
Exceptional
84.9%
Greeks
97.8
/100
|
#86
Exceptional
84.9%

Demographics Similar to Immigrants from Belize by In Labor Force | Age 35-44

In terms of in labor force | age 35-44, the demographic groups most similar to Immigrants from Belize are Fijian (82.9%, a difference of 0.0%), Immigrants from Bangladesh (82.9%, a difference of 0.0%), Immigrants from Dominican Republic (82.9%, a difference of 0.020%), Puget Sound Salish (82.9%, a difference of 0.020%), and Osage (82.9%, a difference of 0.030%).
DemographicsRating | RankIn Labor Force | Age 35-44
Dominicans
0.0
/100
|
#280
Tragic
83.1%
Guatemalans
0.0
/100
|
#281
Tragic
83.0%
Osage
0.0
/100
|
#282
Tragic
82.9%
Immigrants | Guatemala
0.0
/100
|
#283
Tragic
82.9%
Immigrants | Dominican Republic
0.0
/100
|
#284
Tragic
82.9%
Fijians
0.0
/100
|
#285
Tragic
82.9%
Immigrants | Bangladesh
0.0
/100
|
#286
Tragic
82.9%
Immigrants | Belize
0.0
/100
|
#287
Tragic
82.9%
Puget Sound Salish
0.0
/100
|
#288
Tragic
82.9%
Chippewa
0.0
/100
|
#289
Tragic
82.9%
Africans
0.0
/100
|
#290
Tragic
82.9%
Pennsylvania Germans
0.0
/100
|
#291
Tragic
82.9%
Immigrants | Latin America
0.0
/100
|
#292
Tragic
82.8%
Spanish Americans
0.0
/100
|
#293
Tragic
82.8%
Potawatomi
0.0
/100
|
#294
Tragic
82.7%