African vs Immigrants from Belize Male Disability
COMPARE
African
Immigrants from Belize
Male Disability
Male Disability Comparison
Africans
Immigrants from Belize
12.6%
MALE DISABILITY
0.0/ 100
METRIC RATING
276th/ 347
METRIC RANK
11.3%
MALE DISABILITY
33.7/ 100
METRIC RATING
182nd/ 347
METRIC RANK
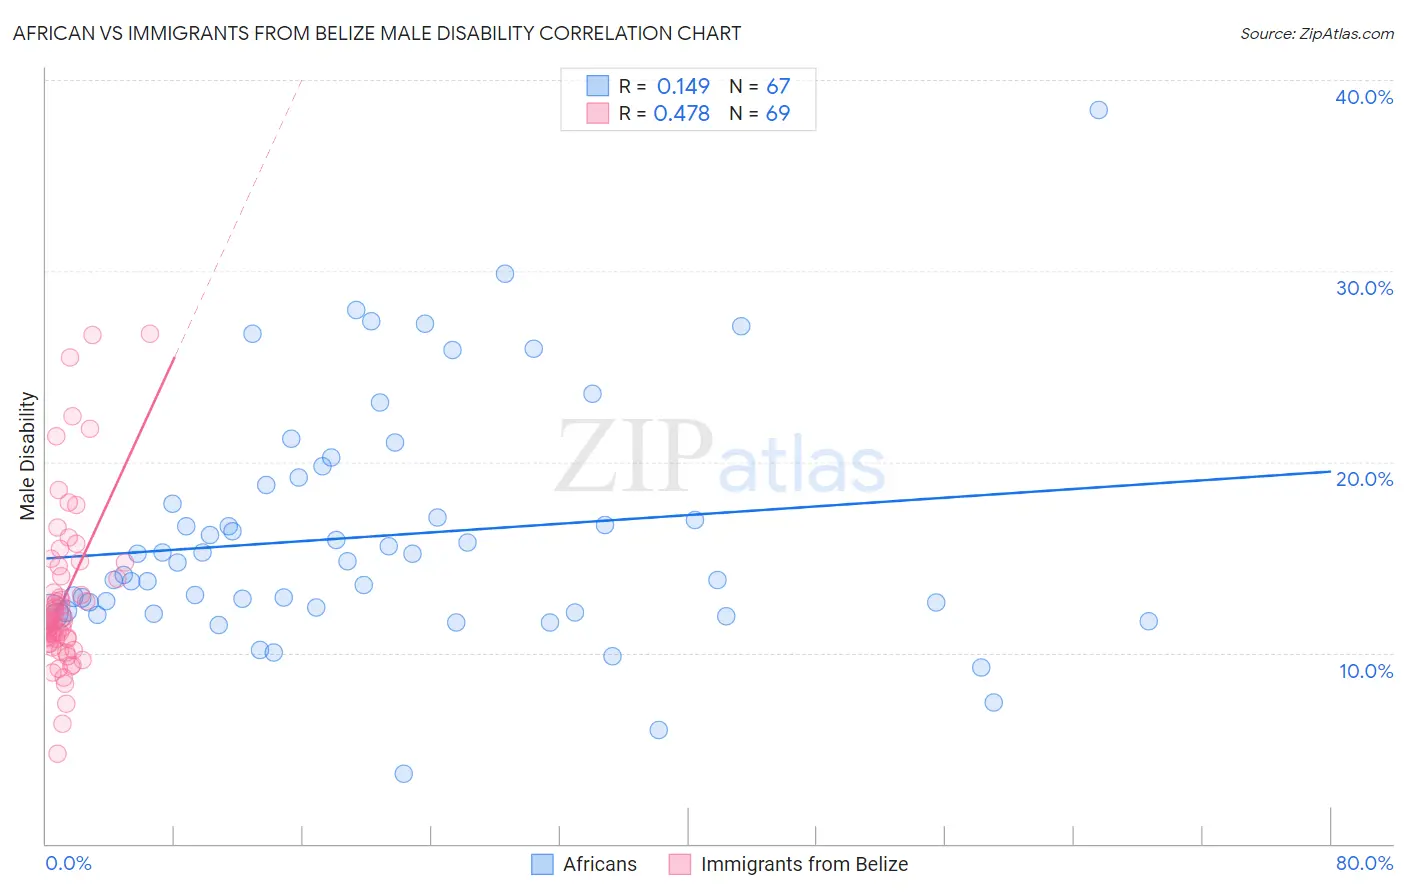
African vs Immigrants from Belize Male Disability Correlation Chart
The statistical analysis conducted on geographies consisting of 469,942,383 people shows a poor positive correlation between the proportion of Africans and percentage of males with a disability in the United States with a correlation coefficient (R) of 0.149 and weighted average of 12.6%. Similarly, the statistical analysis conducted on geographies consisting of 130,304,028 people shows a moderate positive correlation between the proportion of Immigrants from Belize and percentage of males with a disability in the United States with a correlation coefficient (R) of 0.478 and weighted average of 11.3%, a difference of 11.0%.
Male Disability Correlation Summary
| Measurement | African | Immigrants from Belize |
| Minimum | 3.6% | 4.7% |
| Maximum | 38.5% | 26.7% |
| Range | 34.8% | 22.0% |
| Mean | 16.1% | 12.9% |
| Median | 14.7% | 11.7% |
| Interquartile 25% (IQ1) | 12.1% | 10.6% |
| Interquartile 75% (IQ3) | 18.8% | 14.3% |
| Interquartile Range (IQR) | 6.7% | 3.7% |
| Standard Deviation (Sample) | 6.2% | 4.3% |
| Standard Deviation (Population) | 6.2% | 4.3% |
Similar Demographics by Male Disability
Demographics Similar to Africans by Male Disability
In terms of male disability, the demographic groups most similar to Africans are Fijian (12.6%, a difference of 0.050%), Finnish (12.6%, a difference of 0.31%), Hopi (12.5%, a difference of 0.40%), Native Hawaiian (12.5%, a difference of 0.74%), and Hmong (12.5%, a difference of 0.80%).
| Demographics | Rating | Rank | Male Disability |
| Czechoslovakians | 0.1 /100 | #269 | Tragic 12.3% |
| Spaniards | 0.1 /100 | #270 | Tragic 12.3% |
| Scandinavians | 0.1 /100 | #271 | Tragic 12.3% |
| Hmong | 0.0 /100 | #272 | Tragic 12.5% |
| Native Hawaiians | 0.0 /100 | #273 | Tragic 12.5% |
| Hopi | 0.0 /100 | #274 | Tragic 12.5% |
| Fijians | 0.0 /100 | #275 | Tragic 12.6% |
| Africans | 0.0 /100 | #276 | Tragic 12.6% |
| Finns | 0.0 /100 | #277 | Tragic 12.6% |
| Central American Indians | 0.0 /100 | #278 | Tragic 12.7% |
| Slovaks | 0.0 /100 | #279 | Tragic 12.7% |
| Dutch | 0.0 /100 | #280 | Tragic 12.7% |
| Sioux | 0.0 /100 | #281 | Tragic 12.7% |
| Irish | 0.0 /100 | #282 | Tragic 12.7% |
| Germans | 0.0 /100 | #283 | Tragic 12.7% |
Demographics Similar to Immigrants from Belize by Male Disability
In terms of male disability, the demographic groups most similar to Immigrants from Belize are Immigrants from Senegal (11.3%, a difference of 0.040%), Immigrants from Central America (11.3%, a difference of 0.050%), Iraqi (11.3%, a difference of 0.20%), Pakistani (11.3%, a difference of 0.21%), and Immigrants from Zaire (11.4%, a difference of 0.39%).
| Demographics | Rating | Rank | Male Disability |
| Immigrants | Honduras | 48.7 /100 | #175 | Average 11.2% |
| Syrians | 46.6 /100 | #176 | Average 11.2% |
| Immigrants | Norway | 44.2 /100 | #177 | Average 11.3% |
| Australians | 42.2 /100 | #178 | Average 11.3% |
| Immigrants | Caribbean | 41.4 /100 | #179 | Average 11.3% |
| Hondurans | 41.1 /100 | #180 | Average 11.3% |
| Immigrants | Senegal | 34.4 /100 | #181 | Fair 11.3% |
| Immigrants | Belize | 33.7 /100 | #182 | Fair 11.3% |
| Immigrants | Central America | 32.9 /100 | #183 | Fair 11.3% |
| Iraqis | 30.5 /100 | #184 | Fair 11.3% |
| Pakistanis | 30.3 /100 | #185 | Fair 11.3% |
| Immigrants | Zaire | 27.6 /100 | #186 | Fair 11.4% |
| Immigrants | Austria | 27.3 /100 | #187 | Fair 11.4% |
| Estonians | 26.8 /100 | #188 | Fair 11.4% |
| Immigrants | Netherlands | 25.9 /100 | #189 | Fair 11.4% |