Immigrants from Panama vs Immigrants from Belize Male Disability
COMPARE
Immigrants from Panama
Immigrants from Belize
Male Disability
Male Disability Comparison
Immigrants from Panama
Immigrants from Belize
11.5%
MALE DISABILITY
13.0/ 100
METRIC RATING
201st/ 347
METRIC RANK
11.3%
MALE DISABILITY
33.7/ 100
METRIC RATING
182nd/ 347
METRIC RANK
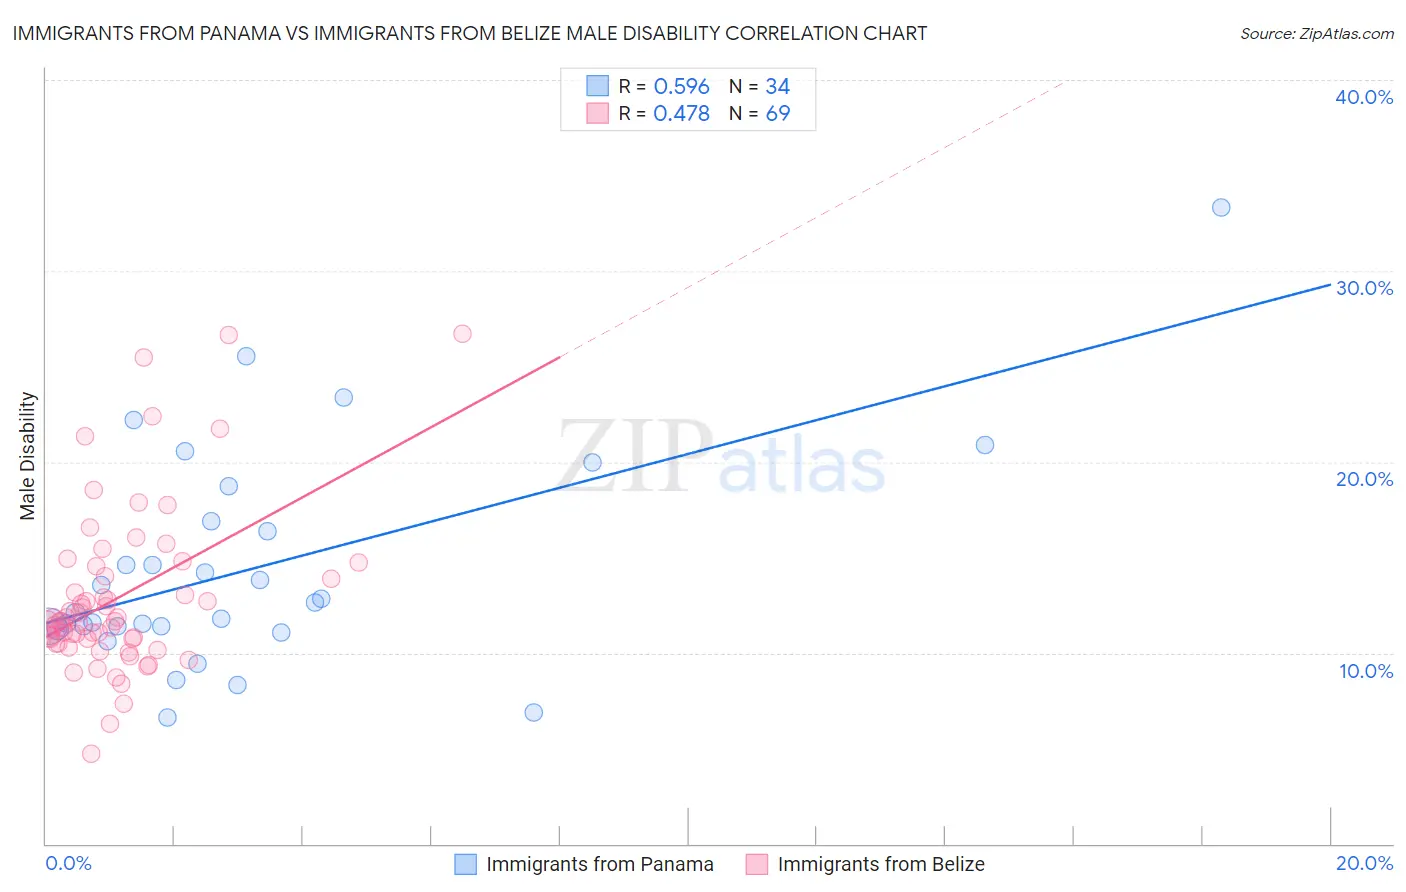
Immigrants from Panama vs Immigrants from Belize Male Disability Correlation Chart
The statistical analysis conducted on geographies consisting of 221,177,932 people shows a substantial positive correlation between the proportion of Immigrants from Panama and percentage of males with a disability in the United States with a correlation coefficient (R) of 0.596 and weighted average of 11.5%. Similarly, the statistical analysis conducted on geographies consisting of 130,304,028 people shows a moderate positive correlation between the proportion of Immigrants from Belize and percentage of males with a disability in the United States with a correlation coefficient (R) of 0.478 and weighted average of 11.3%, a difference of 1.7%.
Male Disability Correlation Summary
| Measurement | Immigrants from Panama | Immigrants from Belize |
| Minimum | 6.6% | 4.7% |
| Maximum | 33.3% | 26.7% |
| Range | 26.7% | 22.0% |
| Mean | 14.4% | 12.9% |
| Median | 12.4% | 11.7% |
| Interquartile 25% (IQ1) | 11.4% | 10.6% |
| Interquartile 75% (IQ3) | 16.9% | 14.3% |
| Interquartile Range (IQR) | 5.5% | 3.7% |
| Standard Deviation (Sample) | 5.7% | 4.3% |
| Standard Deviation (Population) | 5.7% | 4.3% |
Demographics Similar to Immigrants from Panama and Immigrants from Belize by Male Disability
In terms of male disability, the demographic groups most similar to Immigrants from Panama are Immigrants from Iraq (11.5%, a difference of 0.0%), Lebanese (11.5%, a difference of 0.27%), Immigrants from Jamaica (11.5%, a difference of 0.36%), Somali (11.4%, a difference of 0.54%), and West Indian (11.4%, a difference of 0.56%). Similarly, the demographic groups most similar to Immigrants from Belize are Immigrants from Senegal (11.3%, a difference of 0.040%), Immigrants from Central America (11.3%, a difference of 0.050%), Iraqi (11.3%, a difference of 0.20%), Pakistani (11.3%, a difference of 0.21%), and Immigrants from Zaire (11.4%, a difference of 0.39%).
| Demographics | Rating | Rank | Male Disability |
| Immigrants | Senegal | 34.4 /100 | #181 | Fair 11.3% |
| Immigrants | Belize | 33.7 /100 | #182 | Fair 11.3% |
| Immigrants | Central America | 32.9 /100 | #183 | Fair 11.3% |
| Iraqis | 30.5 /100 | #184 | Fair 11.3% |
| Pakistanis | 30.3 /100 | #185 | Fair 11.3% |
| Immigrants | Zaire | 27.6 /100 | #186 | Fair 11.4% |
| Immigrants | Austria | 27.3 /100 | #187 | Fair 11.4% |
| Estonians | 26.8 /100 | #188 | Fair 11.4% |
| Immigrants | Netherlands | 25.9 /100 | #189 | Fair 11.4% |
| Immigrants | Bosnia and Herzegovina | 25.4 /100 | #190 | Fair 11.4% |
| Senegalese | 23.2 /100 | #191 | Fair 11.4% |
| Assyrians/Chaldeans/Syriacs | 23.2 /100 | #192 | Fair 11.4% |
| Greeks | 22.2 /100 | #193 | Fair 11.4% |
| Belizeans | 21.2 /100 | #194 | Fair 11.4% |
| Immigrants | Oceania | 20.9 /100 | #195 | Fair 11.4% |
| West Indians | 18.4 /100 | #196 | Poor 11.4% |
| Somalis | 18.2 /100 | #197 | Poor 11.4% |
| Immigrants | Jamaica | 16.3 /100 | #198 | Poor 11.5% |
| Lebanese | 15.4 /100 | #199 | Poor 11.5% |
| Immigrants | Iraq | 13.0 /100 | #200 | Poor 11.5% |
| Immigrants | Panama | 13.0 /100 | #201 | Poor 11.5% |