Peruvian vs Immigrants from Philippines Self-Care Disability
COMPARE
Peruvian
Immigrants from Philippines
Self-Care Disability
Self-Care Disability Comparison
Peruvians
Immigrants from Philippines
2.4%
SELF-CARE DISABILITY
91.3/ 100
METRIC RATING
121st/ 347
METRIC RANK
2.6%
SELF-CARE DISABILITY
2.7/ 100
METRIC RATING
227th/ 347
METRIC RANK
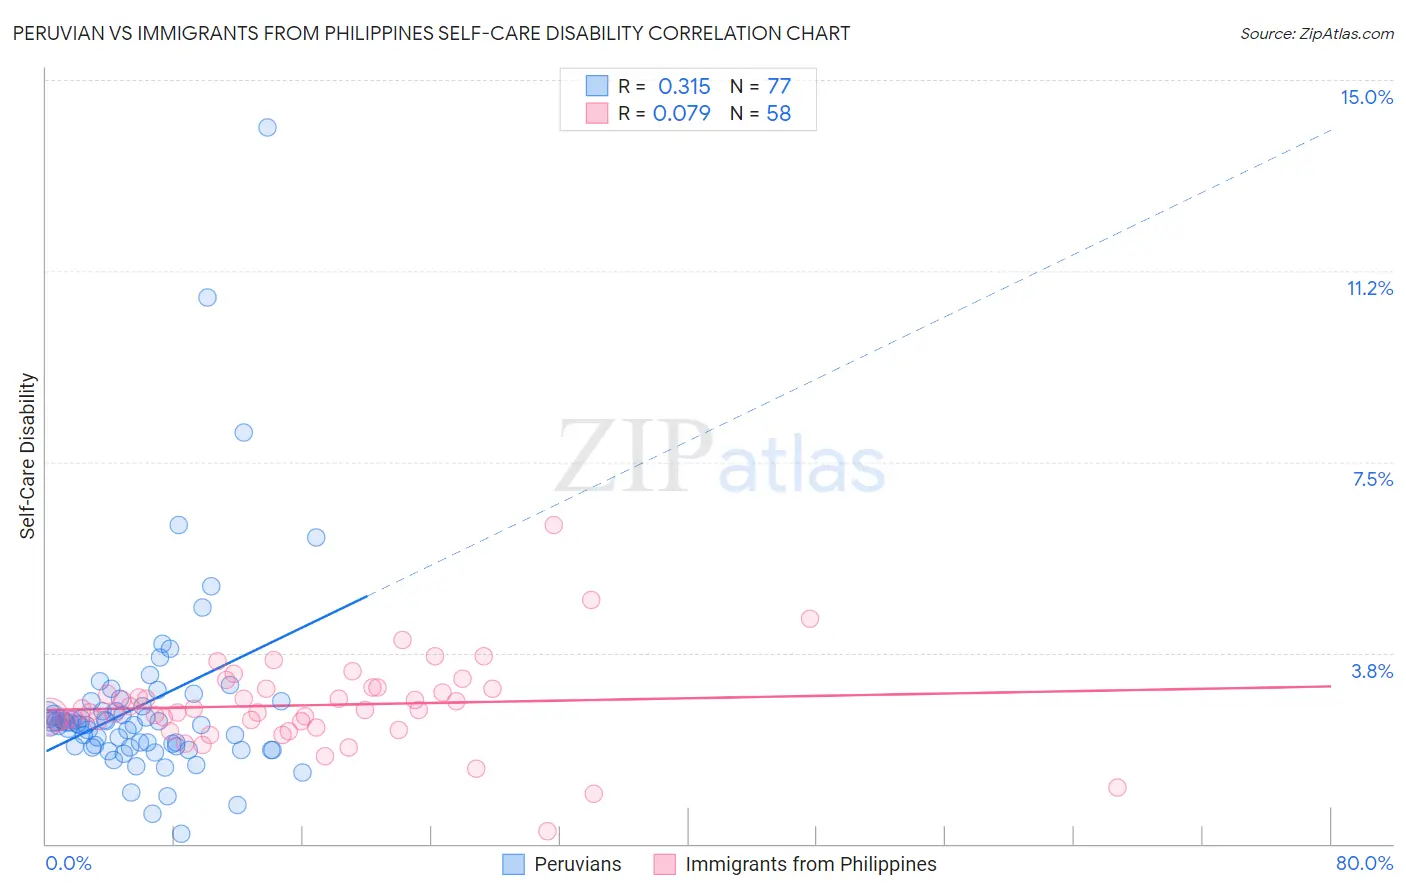
Peruvian vs Immigrants from Philippines Self-Care Disability Correlation Chart
The statistical analysis conducted on geographies consisting of 362,873,301 people shows a mild positive correlation between the proportion of Peruvians and percentage of population with self-care disability in the United States with a correlation coefficient (R) of 0.315 and weighted average of 2.4%. Similarly, the statistical analysis conducted on geographies consisting of 470,541,015 people shows a slight positive correlation between the proportion of Immigrants from Philippines and percentage of population with self-care disability in the United States with a correlation coefficient (R) of 0.079 and weighted average of 2.6%, a difference of 7.3%.
Self-Care Disability Correlation Summary
| Measurement | Peruvian | Immigrants from Philippines |
| Minimum | 0.20% | 0.24% |
| Maximum | 14.1% | 6.2% |
| Range | 13.9% | 6.0% |
| Mean | 2.7% | 2.7% |
| Median | 2.3% | 2.6% |
| Interquartile 25% (IQ1) | 1.9% | 2.4% |
| Interquartile 75% (IQ3) | 2.8% | 3.0% |
| Interquartile Range (IQR) | 0.86% | 0.64% |
| Standard Deviation (Sample) | 2.0% | 0.89% |
| Standard Deviation (Population) | 2.0% | 0.88% |
Similar Demographics by Self-Care Disability
Demographics Similar to Peruvians by Self-Care Disability
In terms of self-care disability, the demographic groups most similar to Peruvians are Uruguayan (2.4%, a difference of 0.030%), Immigrants from Sierra Leone (2.4%, a difference of 0.070%), Belgian (2.4%, a difference of 0.070%), Immigrants from Canada (2.4%, a difference of 0.11%), and Immigrants from Nigeria (2.4%, a difference of 0.15%).
| Demographics | Rating | Rank | Self-Care Disability |
| Immigrants | North Macedonia | 93.1 /100 | #114 | Exceptional 2.4% |
| Immigrants | Hong Kong | 93.1 /100 | #115 | Exceptional 2.4% |
| Northern Europeans | 92.9 /100 | #116 | Exceptional 2.4% |
| Taiwanese | 92.5 /100 | #117 | Exceptional 2.4% |
| Immigrants | Canada | 92.0 /100 | #118 | Exceptional 2.4% |
| Immigrants | Sierra Leone | 91.8 /100 | #119 | Exceptional 2.4% |
| Uruguayans | 91.5 /100 | #120 | Exceptional 2.4% |
| Peruvians | 91.3 /100 | #121 | Exceptional 2.4% |
| Belgians | 90.9 /100 | #122 | Exceptional 2.4% |
| Immigrants | Nigeria | 90.3 /100 | #123 | Exceptional 2.4% |
| Immigrants | North America | 90.2 /100 | #124 | Exceptional 2.4% |
| Immigrants | Morocco | 90.2 /100 | #124 | Exceptional 2.4% |
| Hmong | 89.9 /100 | #126 | Excellent 2.4% |
| Colombians | 89.7 /100 | #127 | Excellent 2.4% |
| Immigrants | Hungary | 89.6 /100 | #128 | Excellent 2.4% |
Demographics Similar to Immigrants from Philippines by Self-Care Disability
In terms of self-care disability, the demographic groups most similar to Immigrants from Philippines are Guatemalan (2.6%, a difference of 0.010%), Chinese (2.6%, a difference of 0.080%), Guamanian/Chamorro (2.6%, a difference of 0.080%), Immigrants from Ecuador (2.6%, a difference of 0.080%), and Iraqi (2.6%, a difference of 0.18%).
| Demographics | Rating | Rank | Self-Care Disability |
| Sub-Saharan Africans | 4.0 /100 | #220 | Tragic 2.6% |
| Hondurans | 3.8 /100 | #221 | Tragic 2.6% |
| Spaniards | 3.8 /100 | #222 | Tragic 2.6% |
| French Canadians | 3.8 /100 | #223 | Tragic 2.6% |
| Osage | 3.6 /100 | #224 | Tragic 2.6% |
| Iraqis | 3.2 /100 | #225 | Tragic 2.6% |
| Chinese | 2.9 /100 | #226 | Tragic 2.6% |
| Immigrants | Philippines | 2.7 /100 | #227 | Tragic 2.6% |
| Guatemalans | 2.7 /100 | #228 | Tragic 2.6% |
| Guamanians/Chamorros | 2.5 /100 | #229 | Tragic 2.6% |
| Immigrants | Ecuador | 2.5 /100 | #230 | Tragic 2.6% |
| Immigrants | Guatemala | 2.2 /100 | #231 | Tragic 2.6% |
| Albanians | 2.2 /100 | #232 | Tragic 2.6% |
| Liberians | 2.1 /100 | #233 | Tragic 2.6% |
| Vietnamese | 2.1 /100 | #234 | Tragic 2.6% |