Pennsylvania German vs Immigrants from Kuwait 1 or more Vehicles in Household
COMPARE
Pennsylvania German
Immigrants from Kuwait
1 or more Vehicles in Household
1 or more Vehicles in Household Comparison
Pennsylvania Germans
Immigrants from Kuwait
89.3%
1 OR MORE VEHICLES IN HOUSEHOLD
22.9/ 100
METRIC RATING
198th/ 347
METRIC RANK
90.7%
1 OR MORE VEHICLES IN HOUSEHOLD
94.7/ 100
METRIC RATING
113th/ 347
METRIC RANK
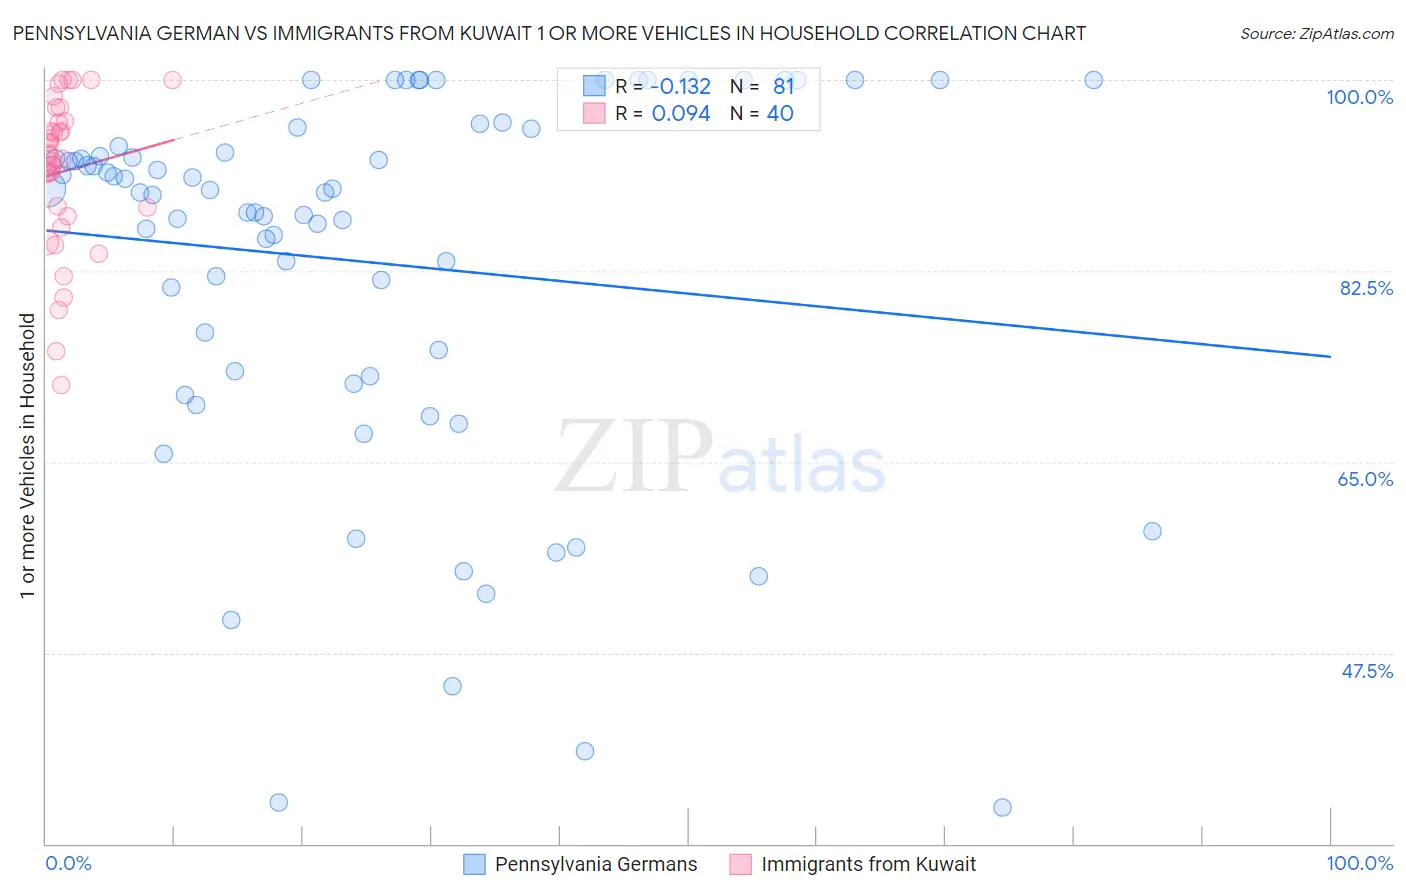
Pennsylvania German vs Immigrants from Kuwait 1 or more Vehicles in Household Correlation Chart
The statistical analysis conducted on geographies consisting of 234,072,991 people shows a poor negative correlation between the proportion of Pennsylvania Germans and percentage of households with 1 or more vehicles available in the United States with a correlation coefficient (R) of -0.132 and weighted average of 89.3%. Similarly, the statistical analysis conducted on geographies consisting of 136,852,839 people shows a slight positive correlation between the proportion of Immigrants from Kuwait and percentage of households with 1 or more vehicles available in the United States with a correlation coefficient (R) of 0.094 and weighted average of 90.7%, a difference of 1.6%.
1 or more Vehicles in Household Correlation Summary
| Measurement | Pennsylvania German | Immigrants from Kuwait |
| Minimum | 33.3% | 72.1% |
| Maximum | 100.0% | 100.0% |
| Range | 66.7% | 27.9% |
| Mean | 83.3% | 91.6% |
| Median | 89.7% | 93.0% |
| Interquartile 25% (IQ1) | 73.1% | 87.9% |
| Interquartile 75% (IQ3) | 94.7% | 96.2% |
| Interquartile Range (IQR) | 21.7% | 8.3% |
| Standard Deviation (Sample) | 17.1% | 7.0% |
| Standard Deviation (Population) | 17.0% | 6.9% |
Similar Demographics by 1 or more Vehicles in Household
Demographics Similar to Pennsylvania Germans by 1 or more Vehicles in Household
In terms of 1 or more vehicles in household, the demographic groups most similar to Pennsylvania Germans are Immigrants from Asia (89.3%, a difference of 0.0%), Immigrants from Sweden (89.3%, a difference of 0.020%), Crow (89.3%, a difference of 0.030%), Central American (89.2%, a difference of 0.040%), and Immigrants from Western Europe (89.2%, a difference of 0.060%).
| Demographics | Rating | Rank | 1 or more Vehicles in Household |
| Immigrants | Poland | 37.1 /100 | #191 | Fair 89.5% |
| Immigrants | North Macedonia | 36.5 /100 | #192 | Fair 89.5% |
| Immigrants | Northern Europe | 35.5 /100 | #193 | Fair 89.5% |
| Immigrants | Eritrea | 33.2 /100 | #194 | Fair 89.4% |
| Immigrants | Armenia | 31.8 /100 | #195 | Fair 89.4% |
| Crow | 24.3 /100 | #196 | Fair 89.3% |
| Immigrants | Sweden | 23.6 /100 | #197 | Fair 89.3% |
| Pennsylvania Germans | 22.9 /100 | #198 | Fair 89.3% |
| Immigrants | Asia | 22.8 /100 | #199 | Fair 89.3% |
| Central Americans | 21.4 /100 | #200 | Fair 89.2% |
| Immigrants | Western Europe | 20.5 /100 | #201 | Fair 89.2% |
| Iroquois | 19.8 /100 | #202 | Poor 89.2% |
| Cambodians | 18.9 /100 | #203 | Poor 89.2% |
| Romanians | 18.2 /100 | #204 | Poor 89.2% |
| Guatemalans | 17.8 /100 | #205 | Poor 89.2% |
Demographics Similar to Immigrants from Kuwait by 1 or more Vehicles in Household
In terms of 1 or more vehicles in household, the demographic groups most similar to Immigrants from Kuwait are Armenian (90.7%, a difference of 0.020%), Serbian (90.7%, a difference of 0.030%), Chippewa (90.7%, a difference of 0.030%), Immigrants from Netherlands (90.8%, a difference of 0.080%), and Navajo (90.8%, a difference of 0.090%).
| Demographics | Rating | Rank | 1 or more Vehicles in Household |
| Zimbabweans | 97.7 /100 | #106 | Exceptional 91.0% |
| Maltese | 97.7 /100 | #107 | Exceptional 91.0% |
| Hispanics or Latinos | 97.6 /100 | #108 | Exceptional 91.0% |
| Delaware | 97.6 /100 | #109 | Exceptional 91.0% |
| Mexican American Indians | 97.4 /100 | #110 | Exceptional 91.0% |
| Navajo | 95.8 /100 | #111 | Exceptional 90.8% |
| Immigrants | Netherlands | 95.7 /100 | #112 | Exceptional 90.8% |
| Immigrants | Kuwait | 94.7 /100 | #113 | Exceptional 90.7% |
| Armenians | 94.5 /100 | #114 | Exceptional 90.7% |
| Serbians | 94.3 /100 | #115 | Exceptional 90.7% |
| Chippewa | 94.3 /100 | #116 | Exceptional 90.7% |
| Greeks | 93.5 /100 | #117 | Exceptional 90.6% |
| Japanese | 93.4 /100 | #118 | Exceptional 90.6% |
| Blackfeet | 92.6 /100 | #119 | Exceptional 90.6% |
| Immigrants | Thailand | 92.3 /100 | #120 | Exceptional 90.6% |