Immigrants from Grenada vs Immigrants from Kuwait Disability Age 5 to 17
COMPARE
Immigrants from Grenada
Immigrants from Kuwait
Disability Age 5 to 17
Disability Age 5 to 17 Comparison
Immigrants from Grenada
Immigrants from Kuwait
5.3%
DISABILITY AGE 5 TO 17
99.1/ 100
METRIC RATING
95th/ 347
METRIC RANK
5.3%
DISABILITY AGE 5 TO 17
99.4/ 100
METRIC RATING
90th/ 347
METRIC RANK
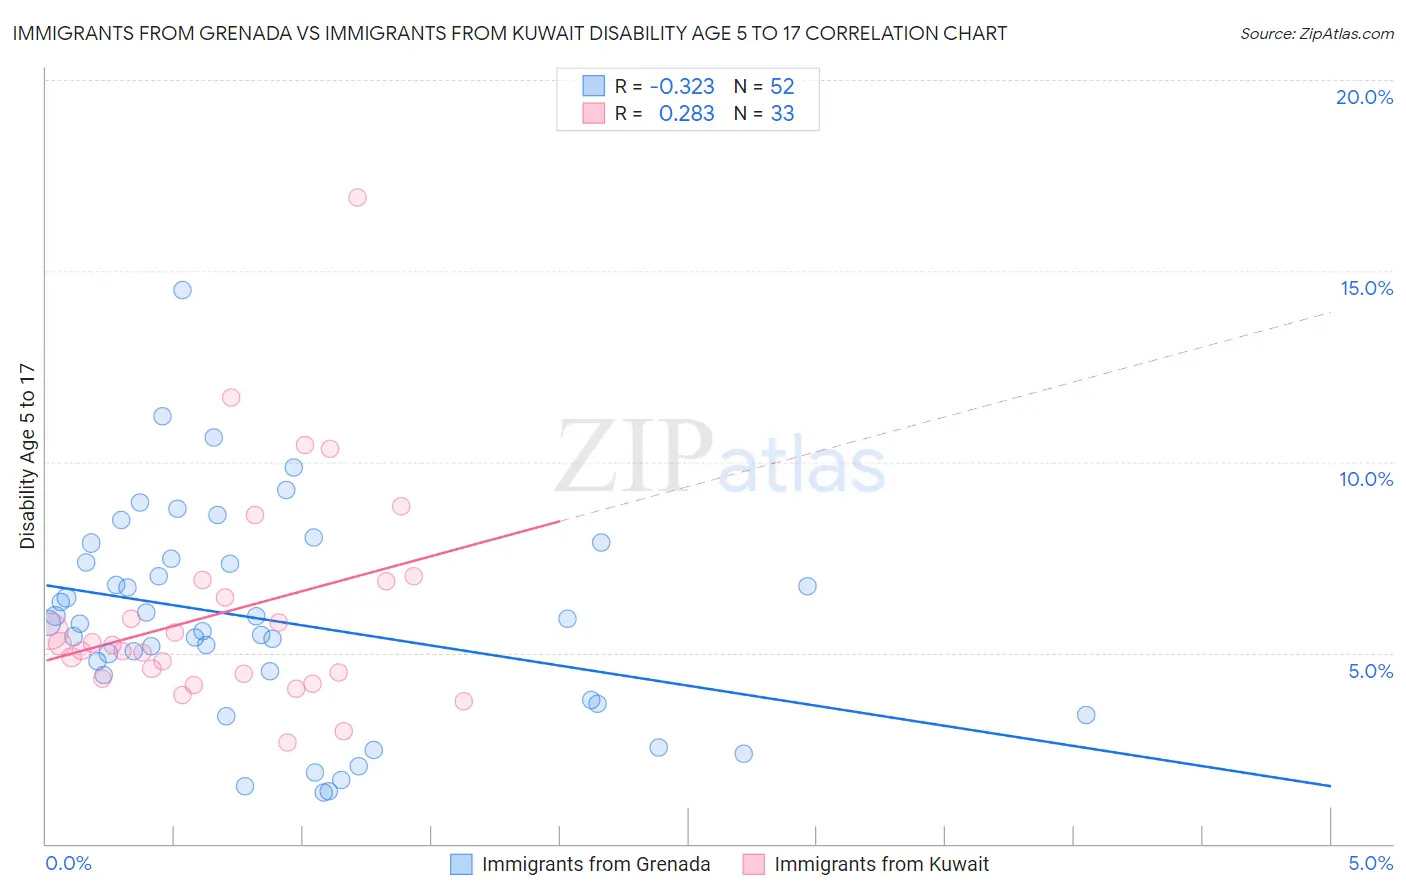
Immigrants from Grenada vs Immigrants from Kuwait Disability Age 5 to 17 Correlation Chart
The statistical analysis conducted on geographies consisting of 67,127,267 people shows a mild negative correlation between the proportion of Immigrants from Grenada and percentage of population with a disability between the ages 5 and 17 in the United States with a correlation coefficient (R) of -0.323 and weighted average of 5.3%. Similarly, the statistical analysis conducted on geographies consisting of 136,559,233 people shows a weak positive correlation between the proportion of Immigrants from Kuwait and percentage of population with a disability between the ages 5 and 17 in the United States with a correlation coefficient (R) of 0.283 and weighted average of 5.3%, a difference of 0.46%.
Disability Age 5 to 17 Correlation Summary
| Measurement | Immigrants from Grenada | Immigrants from Kuwait |
| Minimum | 1.4% | 2.7% |
| Maximum | 14.5% | 16.9% |
| Range | 13.2% | 14.3% |
| Mean | 5.9% | 6.1% |
| Median | 5.8% | 5.2% |
| Interquartile 25% (IQ1) | 4.1% | 4.4% |
| Interquartile 75% (IQ3) | 7.4% | 6.9% |
| Interquartile Range (IQR) | 3.3% | 2.5% |
| Standard Deviation (Sample) | 2.7% | 2.9% |
| Standard Deviation (Population) | 2.7% | 2.8% |
Demographics Similar to Immigrants from Grenada and Immigrants from Kuwait by Disability Age 5 to 17
In terms of disability age 5 to 17, the demographic groups most similar to Immigrants from Grenada are Immigrants from Jordan (5.3%, a difference of 0.020%), Immigrants from Peru (5.3%, a difference of 0.090%), Luxembourger (5.3%, a difference of 0.16%), Immigrants from El Salvador (5.3%, a difference of 0.16%), and Immigrants from Europe (5.3%, a difference of 0.16%). Similarly, the demographic groups most similar to Immigrants from Kuwait are Immigrants from Croatia (5.2%, a difference of 0.050%), Immigrants from Spain (5.2%, a difference of 0.050%), Eastern European (5.2%, a difference of 0.080%), Immigrants from St. Vincent and the Grenadines (5.2%, a difference of 0.13%), and Bulgarian (5.2%, a difference of 0.17%).
| Demographics | Rating | Rank | Disability Age 5 to 17 |
| Immigrants | Sweden | 99.5 /100 | #82 | Exceptional 5.2% |
| Immigrants | France | 99.5 /100 | #83 | Exceptional 5.2% |
| Immigrants | Nicaragua | 99.5 /100 | #84 | Exceptional 5.2% |
| Bulgarians | 99.4 /100 | #85 | Exceptional 5.2% |
| Immigrants | St. Vincent and the Grenadines | 99.4 /100 | #86 | Exceptional 5.2% |
| Eastern Europeans | 99.4 /100 | #87 | Exceptional 5.2% |
| Immigrants | Croatia | 99.4 /100 | #88 | Exceptional 5.2% |
| Immigrants | Spain | 99.4 /100 | #89 | Exceptional 5.2% |
| Immigrants | Kuwait | 99.4 /100 | #90 | Exceptional 5.3% |
| Mongolians | 99.2 /100 | #91 | Exceptional 5.3% |
| Luxembourgers | 99.2 /100 | #92 | Exceptional 5.3% |
| Immigrants | Peru | 99.1 /100 | #93 | Exceptional 5.3% |
| Immigrants | Jordan | 99.1 /100 | #94 | Exceptional 5.3% |
| Immigrants | Grenada | 99.1 /100 | #95 | Exceptional 5.3% |
| Immigrants | El Salvador | 99.0 /100 | #96 | Exceptional 5.3% |
| Immigrants | Europe | 99.0 /100 | #97 | Exceptional 5.3% |
| Immigrants | Austria | 98.9 /100 | #98 | Exceptional 5.3% |
| Cambodians | 98.8 /100 | #99 | Exceptional 5.3% |
| Nepalese | 98.7 /100 | #100 | Exceptional 5.3% |
| Menominee | 98.7 /100 | #101 | Exceptional 5.3% |
| Nicaraguans | 98.6 /100 | #102 | Exceptional 5.3% |