Paraguayan vs Marshallese In Labor Force | Age 25-29
COMPARE
Paraguayan
Marshallese
In Labor Force | Age 25-29
In Labor Force | Age 25-29 Comparison
Paraguayans
Marshallese
85.9%
IN LABOR FORCE | AGE 25-29
100.0/ 100
METRIC RATING
27th/ 347
METRIC RANK
83.3%
IN LABOR FORCE | AGE 25-29
0.0/ 100
METRIC RATING
274th/ 347
METRIC RANK
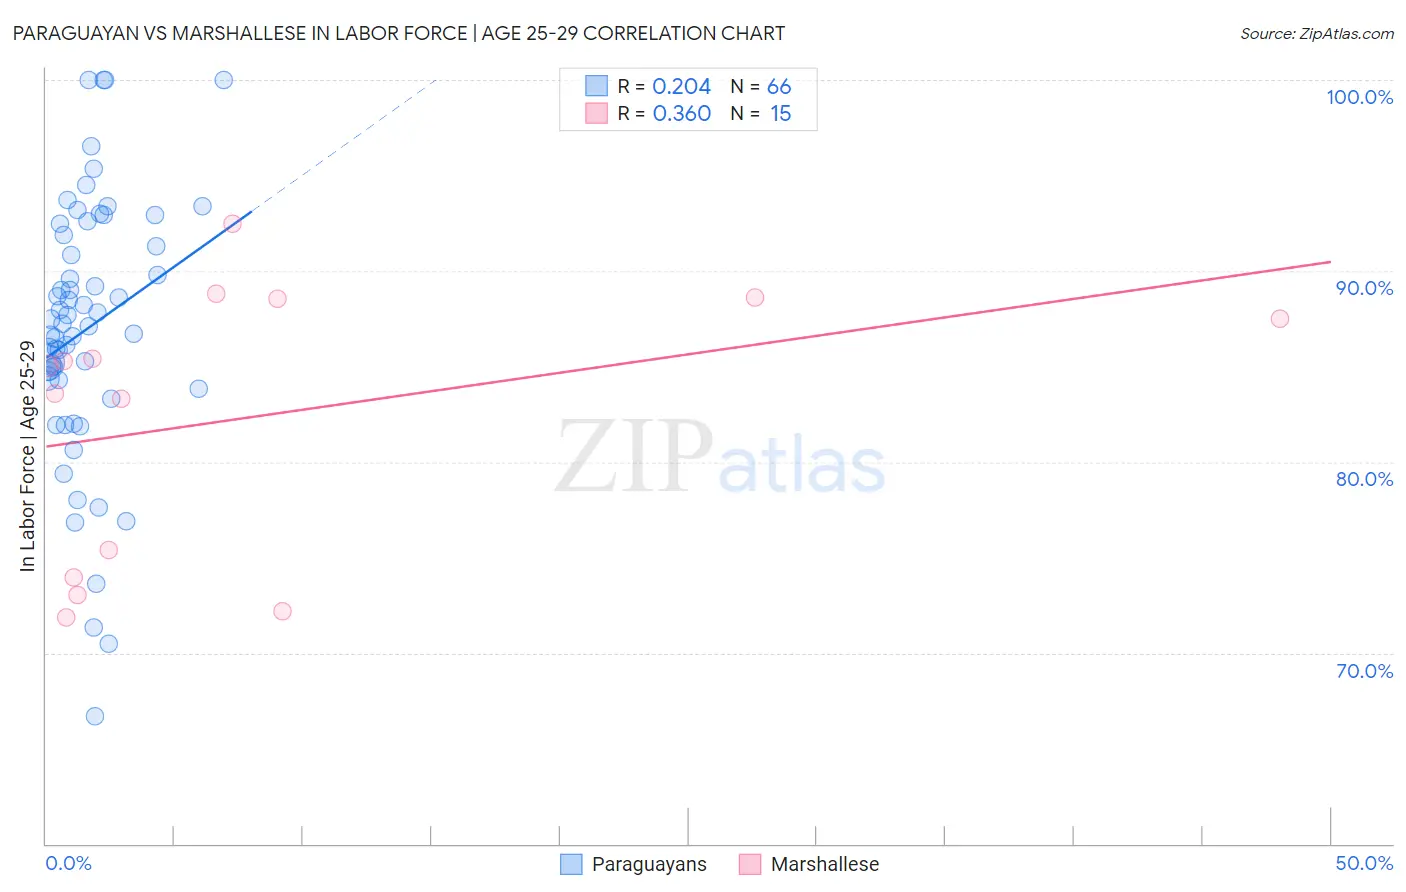
Paraguayan vs Marshallese In Labor Force | Age 25-29 Correlation Chart
The statistical analysis conducted on geographies consisting of 95,105,019 people shows a weak positive correlation between the proportion of Paraguayans and labor force participation rate among population between the ages 25 and 29 in the United States with a correlation coefficient (R) of 0.204 and weighted average of 85.9%. Similarly, the statistical analysis conducted on geographies consisting of 14,760,991 people shows a mild positive correlation between the proportion of Marshallese and labor force participation rate among population between the ages 25 and 29 in the United States with a correlation coefficient (R) of 0.360 and weighted average of 83.3%, a difference of 3.1%.
In Labor Force | Age 25-29 Correlation Summary
| Measurement | Paraguayan | Marshallese |
| Minimum | 66.7% | 71.9% |
| Maximum | 100.0% | 92.5% |
| Range | 33.3% | 20.6% |
| Mean | 87.0% | 82.3% |
| Median | 87.2% | 85.0% |
| Interquartile 25% (IQ1) | 84.3% | 74.0% |
| Interquartile 75% (IQ3) | 91.9% | 88.6% |
| Interquartile Range (IQR) | 7.6% | 14.6% |
| Standard Deviation (Sample) | 6.9% | 7.0% |
| Standard Deviation (Population) | 6.8% | 6.8% |
Similar Demographics by In Labor Force | Age 25-29
Demographics Similar to Paraguayans by In Labor Force | Age 25-29
In terms of in labor force | age 25-29, the demographic groups most similar to Paraguayans are Immigrants from North Macedonia (85.9%, a difference of 0.010%), Ugandan (85.9%, a difference of 0.010%), Immigrants from Liberia (85.9%, a difference of 0.010%), Immigrants from Serbia (85.9%, a difference of 0.050%), and German Russian (85.8%, a difference of 0.060%).
| Demographics | Rating | Rank | In Labor Force | Age 25-29 |
| Immigrants | Ireland | 100.0 /100 | #20 | Exceptional 86.0% |
| Maltese | 100.0 /100 | #21 | Exceptional 86.0% |
| Cambodians | 100.0 /100 | #22 | Exceptional 86.0% |
| Immigrants | Uganda | 100.0 /100 | #23 | Exceptional 86.0% |
| Immigrants | Eastern Africa | 100.0 /100 | #24 | Exceptional 86.0% |
| Sudanese | 100.0 /100 | #25 | Exceptional 85.9% |
| Immigrants | North Macedonia | 100.0 /100 | #26 | Exceptional 85.9% |
| Paraguayans | 100.0 /100 | #27 | Exceptional 85.9% |
| Ugandans | 100.0 /100 | #28 | Exceptional 85.9% |
| Immigrants | Liberia | 100.0 /100 | #29 | Exceptional 85.9% |
| Immigrants | Serbia | 100.0 /100 | #30 | Exceptional 85.9% |
| German Russians | 100.0 /100 | #31 | Exceptional 85.8% |
| Slovaks | 100.0 /100 | #32 | Exceptional 85.8% |
| Immigrants | Bulgaria | 100.0 /100 | #33 | Exceptional 85.8% |
| Lithuanians | 99.9 /100 | #34 | Exceptional 85.8% |
Demographics Similar to Marshallese by In Labor Force | Age 25-29
In terms of in labor force | age 25-29, the demographic groups most similar to Marshallese are Immigrants from Caribbean (83.4%, a difference of 0.030%), Immigrants from Dominica (83.4%, a difference of 0.030%), Samoan (83.3%, a difference of 0.050%), Immigrants from Honduras (83.3%, a difference of 0.050%), and Honduran (83.4%, a difference of 0.060%).
| Demographics | Rating | Rank | In Labor Force | Age 25-29 |
| Spanish Americans | 0.0 /100 | #267 | Tragic 83.4% |
| Immigrants | Lebanon | 0.0 /100 | #268 | Tragic 83.4% |
| Immigrants | Barbados | 0.0 /100 | #269 | Tragic 83.4% |
| Basques | 0.0 /100 | #270 | Tragic 83.4% |
| Hondurans | 0.0 /100 | #271 | Tragic 83.4% |
| Immigrants | Caribbean | 0.0 /100 | #272 | Tragic 83.4% |
| Immigrants | Dominica | 0.0 /100 | #273 | Tragic 83.4% |
| Marshallese | 0.0 /100 | #274 | Tragic 83.3% |
| Samoans | 0.0 /100 | #275 | Tragic 83.3% |
| Immigrants | Honduras | 0.0 /100 | #276 | Tragic 83.3% |
| Africans | 0.0 /100 | #277 | Tragic 83.2% |
| Immigrants | Cuba | 0.0 /100 | #278 | Tragic 83.2% |
| British West Indians | 0.0 /100 | #279 | Tragic 83.2% |
| Dominicans | 0.0 /100 | #280 | Tragic 83.2% |
| Immigrants | Dominican Republic | 0.0 /100 | #281 | Tragic 83.1% |