Immigrants from Bulgaria vs Senegalese Self-Care Disability
COMPARE
Immigrants from Bulgaria
Senegalese
Self-Care Disability
Self-Care Disability Comparison
Immigrants from Bulgaria
Senegalese
2.3%
SELF-CARE DISABILITY
99.8/ 100
METRIC RATING
39th/ 347
METRIC RANK
2.6%
SELF-CARE DISABILITY
1.3/ 100
METRIC RATING
238th/ 347
METRIC RANK
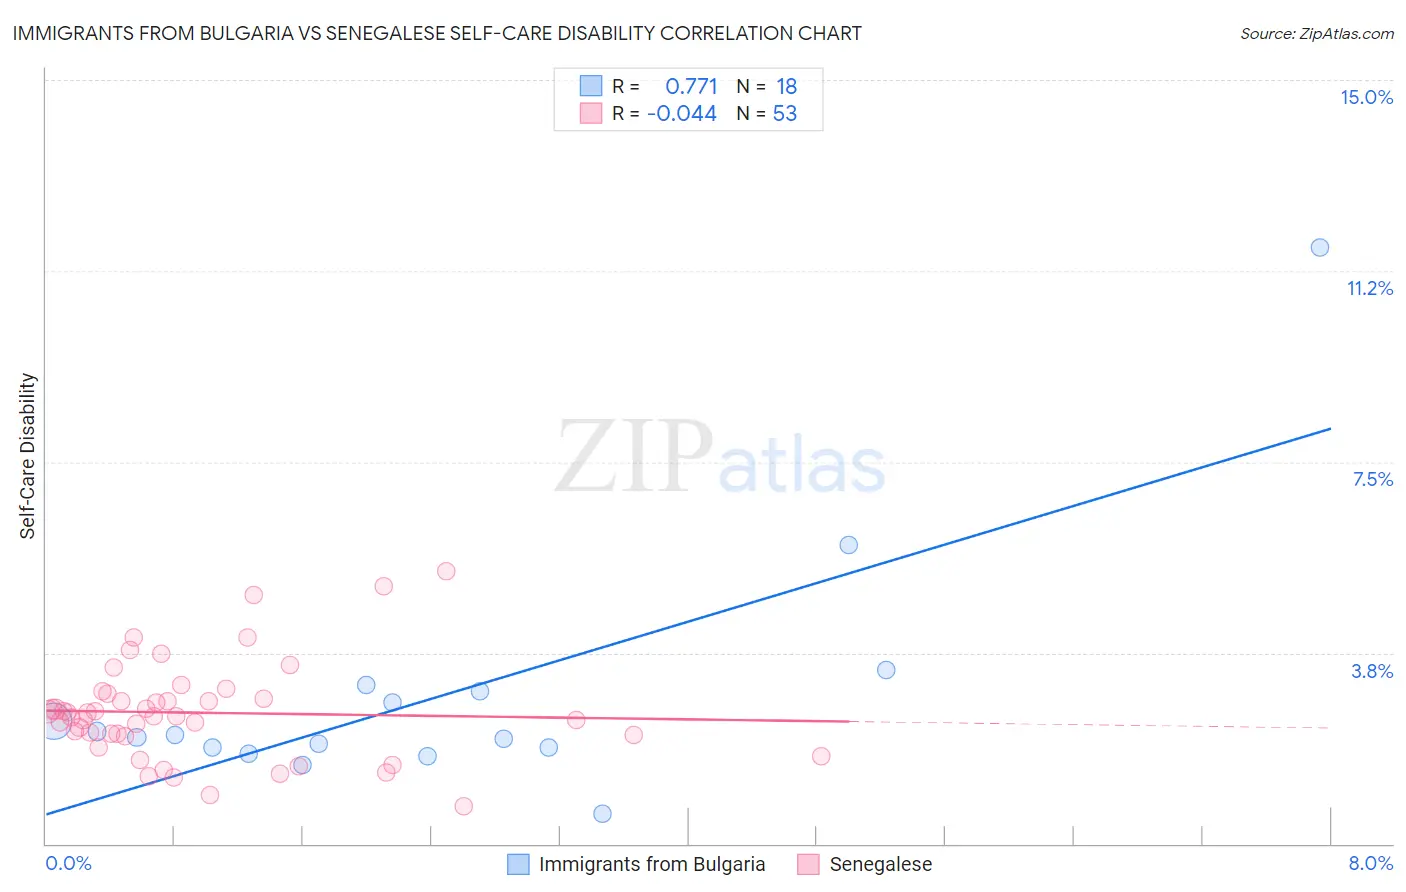
Immigrants from Bulgaria vs Senegalese Self-Care Disability Correlation Chart
The statistical analysis conducted on geographies consisting of 172,509,254 people shows a strong positive correlation between the proportion of Immigrants from Bulgaria and percentage of population with self-care disability in the United States with a correlation coefficient (R) of 0.771 and weighted average of 2.3%. Similarly, the statistical analysis conducted on geographies consisting of 78,103,112 people shows no correlation between the proportion of Senegalese and percentage of population with self-care disability in the United States with a correlation coefficient (R) of -0.044 and weighted average of 2.6%, a difference of 14.0%.
Self-Care Disability Correlation Summary
| Measurement | Immigrants from Bulgaria | Senegalese |
| Minimum | 0.60% | 0.74% |
| Maximum | 11.7% | 5.3% |
| Range | 11.1% | 4.6% |
| Mean | 2.9% | 2.6% |
| Median | 2.1% | 2.5% |
| Interquartile 25% (IQ1) | 1.9% | 2.1% |
| Interquartile 75% (IQ3) | 3.0% | 2.9% |
| Interquartile Range (IQR) | 1.1% | 0.77% |
| Standard Deviation (Sample) | 2.4% | 0.96% |
| Standard Deviation (Population) | 2.4% | 0.95% |
Similar Demographics by Self-Care Disability
Demographics Similar to Immigrants from Bulgaria by Self-Care Disability
In terms of self-care disability, the demographic groups most similar to Immigrants from Bulgaria are Iranian (2.3%, a difference of 0.040%), Immigrants from Eastern Africa (2.3%, a difference of 0.10%), Immigrants from Sudan (2.3%, a difference of 0.11%), Immigrants from Uganda (2.3%, a difference of 0.21%), and Immigrants from Sweden (2.3%, a difference of 0.23%).
| Demographics | Rating | Rank | Self-Care Disability |
| Burmese | 99.9 /100 | #32 | Exceptional 2.3% |
| Immigrants | Korea | 99.9 /100 | #33 | Exceptional 2.3% |
| Immigrants | Turkey | 99.9 /100 | #34 | Exceptional 2.3% |
| Immigrants | Australia | 99.9 /100 | #35 | Exceptional 2.3% |
| Immigrants | Lithuania | 99.9 /100 | #36 | Exceptional 2.3% |
| Immigrants | Sweden | 99.9 /100 | #37 | Exceptional 2.3% |
| Immigrants | Eastern Africa | 99.9 /100 | #38 | Exceptional 2.3% |
| Immigrants | Bulgaria | 99.8 /100 | #39 | Exceptional 2.3% |
| Iranians | 99.8 /100 | #40 | Exceptional 2.3% |
| Immigrants | Sudan | 99.8 /100 | #41 | Exceptional 2.3% |
| Immigrants | Uganda | 99.8 /100 | #42 | Exceptional 2.3% |
| Immigrants | Pakistan | 99.8 /100 | #43 | Exceptional 2.3% |
| Immigrants | South Africa | 99.8 /100 | #44 | Exceptional 2.3% |
| Norwegians | 99.8 /100 | #45 | Exceptional 2.3% |
| Czechs | 99.8 /100 | #46 | Exceptional 2.3% |
Demographics Similar to Senegalese by Self-Care Disability
In terms of self-care disability, the demographic groups most similar to Senegalese are Immigrants from Panama (2.6%, a difference of 0.040%), Marshallese (2.6%, a difference of 0.070%), Immigrants from Syria (2.6%, a difference of 0.24%), Immigrants from Senegal (2.6%, a difference of 0.26%), and Bermudan (2.6%, a difference of 0.46%).
| Demographics | Rating | Rank | Self-Care Disability |
| Immigrants | Guatemala | 2.2 /100 | #231 | Tragic 2.6% |
| Albanians | 2.2 /100 | #232 | Tragic 2.6% |
| Liberians | 2.1 /100 | #233 | Tragic 2.6% |
| Vietnamese | 2.1 /100 | #234 | Tragic 2.6% |
| Bahamians | 2.0 /100 | #235 | Tragic 2.6% |
| Bermudans | 1.9 /100 | #236 | Tragic 2.6% |
| Immigrants | Senegal | 1.6 /100 | #237 | Tragic 2.6% |
| Senegalese | 1.3 /100 | #238 | Tragic 2.6% |
| Immigrants | Panama | 1.2 /100 | #239 | Tragic 2.6% |
| Marshallese | 1.2 /100 | #240 | Tragic 2.6% |
| Immigrants | Syria | 1.0 /100 | #241 | Tragic 2.6% |
| Spanish | 0.8 /100 | #242 | Tragic 2.6% |
| Hawaiians | 0.8 /100 | #243 | Tragic 2.6% |
| Yuman | 0.8 /100 | #244 | Tragic 2.6% |
| Immigrants | Western Asia | 0.6 /100 | #245 | Tragic 2.6% |