Immigrants from Sri Lanka vs Senegalese Self-Care Disability
COMPARE
Immigrants from Sri Lanka
Senegalese
Self-Care Disability
Self-Care Disability Comparison
Immigrants from Sri Lanka
Senegalese
2.2%
SELF-CARE DISABILITY
99.9/ 100
METRIC RATING
26th/ 347
METRIC RANK
2.6%
SELF-CARE DISABILITY
1.3/ 100
METRIC RATING
238th/ 347
METRIC RANK
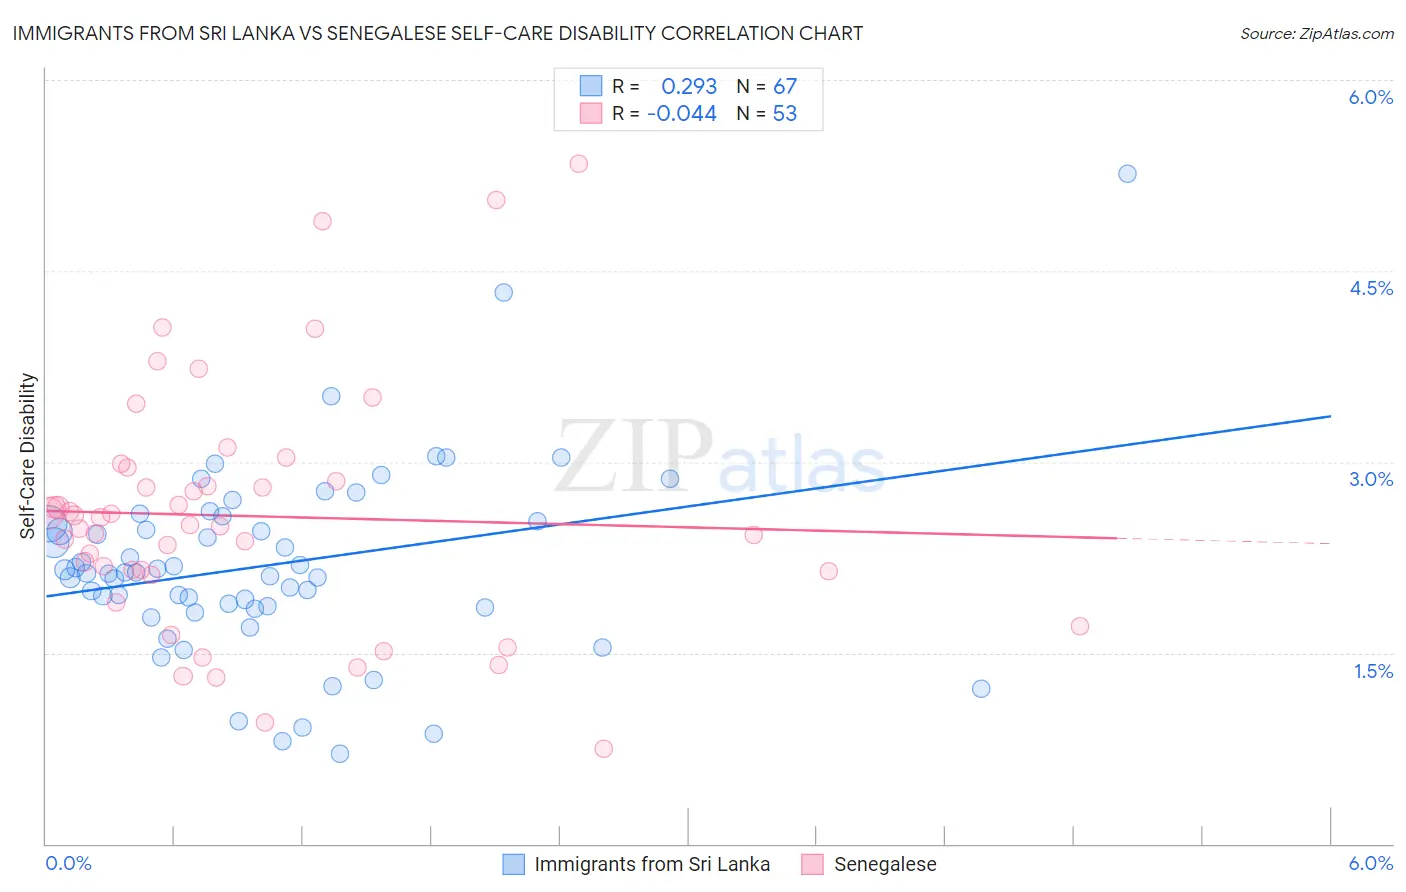
Immigrants from Sri Lanka vs Senegalese Self-Care Disability Correlation Chart
The statistical analysis conducted on geographies consisting of 149,648,116 people shows a weak positive correlation between the proportion of Immigrants from Sri Lanka and percentage of population with self-care disability in the United States with a correlation coefficient (R) of 0.293 and weighted average of 2.2%. Similarly, the statistical analysis conducted on geographies consisting of 78,103,112 people shows no correlation between the proportion of Senegalese and percentage of population with self-care disability in the United States with a correlation coefficient (R) of -0.044 and weighted average of 2.6%, a difference of 15.6%.
Self-Care Disability Correlation Summary
| Measurement | Immigrants from Sri Lanka | Senegalese |
| Minimum | 0.71% | 0.74% |
| Maximum | 5.3% | 5.3% |
| Range | 4.6% | 4.6% |
| Mean | 2.2% | 2.6% |
| Median | 2.1% | 2.5% |
| Interquartile 25% (IQ1) | 1.9% | 2.1% |
| Interquartile 75% (IQ3) | 2.5% | 2.9% |
| Interquartile Range (IQR) | 0.68% | 0.77% |
| Standard Deviation (Sample) | 0.75% | 0.96% |
| Standard Deviation (Population) | 0.74% | 0.95% |
Similar Demographics by Self-Care Disability
Demographics Similar to Immigrants from Sri Lanka by Self-Care Disability
In terms of self-care disability, the demographic groups most similar to Immigrants from Sri Lanka are Venezuelan (2.2%, a difference of 0.010%), Turkish (2.2%, a difference of 0.070%), Inupiat (2.2%, a difference of 0.17%), Cypriot (2.2%, a difference of 0.18%), and Immigrants from Zimbabwe (2.3%, a difference of 0.26%).
| Demographics | Rating | Rank | Self-Care Disability |
| Immigrants | Eritrea | 100.0 /100 | #19 | Exceptional 2.2% |
| Tongans | 100.0 /100 | #20 | Exceptional 2.2% |
| Bulgarians | 100.0 /100 | #21 | Exceptional 2.2% |
| Immigrants | Venezuela | 100.0 /100 | #22 | Exceptional 2.2% |
| Cambodians | 100.0 /100 | #23 | Exceptional 2.2% |
| Cypriots | 100.0 /100 | #24 | Exceptional 2.2% |
| Turks | 100.0 /100 | #25 | Exceptional 2.2% |
| Immigrants | Sri Lanka | 99.9 /100 | #26 | Exceptional 2.2% |
| Venezuelans | 99.9 /100 | #27 | Exceptional 2.2% |
| Inupiat | 99.9 /100 | #28 | Exceptional 2.2% |
| Immigrants | Zimbabwe | 99.9 /100 | #29 | Exceptional 2.3% |
| Paraguayans | 99.9 /100 | #30 | Exceptional 2.3% |
| Danes | 99.9 /100 | #31 | Exceptional 2.3% |
| Burmese | 99.9 /100 | #32 | Exceptional 2.3% |
| Immigrants | Korea | 99.9 /100 | #33 | Exceptional 2.3% |
Demographics Similar to Senegalese by Self-Care Disability
In terms of self-care disability, the demographic groups most similar to Senegalese are Immigrants from Panama (2.6%, a difference of 0.040%), Marshallese (2.6%, a difference of 0.070%), Immigrants from Syria (2.6%, a difference of 0.24%), Immigrants from Senegal (2.6%, a difference of 0.26%), and Bermudan (2.6%, a difference of 0.46%).
| Demographics | Rating | Rank | Self-Care Disability |
| Immigrants | Guatemala | 2.2 /100 | #231 | Tragic 2.6% |
| Albanians | 2.2 /100 | #232 | Tragic 2.6% |
| Liberians | 2.1 /100 | #233 | Tragic 2.6% |
| Vietnamese | 2.1 /100 | #234 | Tragic 2.6% |
| Bahamians | 2.0 /100 | #235 | Tragic 2.6% |
| Bermudans | 1.9 /100 | #236 | Tragic 2.6% |
| Immigrants | Senegal | 1.6 /100 | #237 | Tragic 2.6% |
| Senegalese | 1.3 /100 | #238 | Tragic 2.6% |
| Immigrants | Panama | 1.2 /100 | #239 | Tragic 2.6% |
| Marshallese | 1.2 /100 | #240 | Tragic 2.6% |
| Immigrants | Syria | 1.0 /100 | #241 | Tragic 2.6% |
| Spanish | 0.8 /100 | #242 | Tragic 2.6% |
| Hawaiians | 0.8 /100 | #243 | Tragic 2.6% |
| Yuman | 0.8 /100 | #244 | Tragic 2.6% |
| Immigrants | Western Asia | 0.6 /100 | #245 | Tragic 2.6% |