Palestinian vs Indian (Asian) Self-Care Disability

COMPARE

Palestinian
Race
Ancestry
AfghanAfricanAlaska NativeAlaskan AthabascanAlbanianAleutAlsatianAmericanApacheArabArapahoArgentineanArmenianAssyrian/Chaldean/SyriacAustralianAustrianBahamianBangladeshiBarbadianBasqueBelgianBelizeanBermudanBhutaneseBlackfeetBolivianBrazilianBritishBritish West IndianBulgarianBurmeseCajunCambodianCanadianCape VerdeanCarpatho RusynCelticCentral AmericanCentral American IndianCherokeeCheyenneChickasawChileanChineseChippewaChoctawColombianColvilleComancheCosta RicanCreeCreekCroatianCrowCubanCypriotCzechCzechoslovakianDanishDelawareDominicanDutchDutch West IndianEastern EuropeanEcuadorianEgyptianEnglishEstonianEthiopianEuropeanFijianFilipinoFinnishFrenchFrench American IndianFrench CanadianGermanGerman RussianGhanaianGreekGuamanian/ChamorroGuatemalanGuyaneseHaitianHmongHonduranHopiHoumaHungarianIcelanderIndonesianInupiatIranianIraqiIrishIroquoisIsraeliItalianJamaicanJapaneseJordanianKenyanKiowaKoreanLaotianLatvianLebaneseLiberianLithuanianLumbeeLuxembourgerMacedonianMalaysianMalteseMarshalleseMenomineeMexicanMexican American IndianMongolianMoroccanNative HawaiianNavajoNepaleseNew ZealanderNicaraguanNigerianNorthern EuropeanNorwegianOkinawanOsageOttawaPaiutePakistaniPalestinianPanamanianParaguayanPennsylvania GermanPeruvianPimaPolishPortuguesePotawatomiPuebloPuerto RicanPuget Sound SalishRomanianRussianSalvadoranSamoanScandinavianScotch-IrishScottishSeminoleSenegaleseSerbianShoshoneSierra LeoneanSiouxSlavicSlovakSloveneSomaliSouth AfricanSouth AmericanSouth American IndianSoviet UnionSpaniardSpanishSpanish AmericanSpanish American IndianSri LankanSubsaharan AfricanSudaneseSwedishSwissSyrianTaiwaneseThaiTlingit-HaidaTohono O'OdhamTonganTrinidadian and TobagonianTsimshianTurkishU.S. Virgin IslanderUgandanUkrainianUruguayanUteVenezuelanVietnameseWelshWest IndianYakamaYaquiYugoslavianYumanYup'ikZimbabwean
Immigration
NonimmigrantsImmigrantsAfghanistanAfricaAlbaniaArgentinaArmeniaAsiaAustraliaAustriaBahamasBangladeshBarbadosBelarusBelgiumBelizeBoliviaBosnia and HerzegovinaBrazilBulgariaBurma/MyanmarCabo VerdeCambodiaCameroonCanadaCaribbeanCentral AmericaChileChinaColombiaCongoCosta RicaCroatiaCubaCzechoslovakiaDenmarkDominicaDominican RepublicEastern AfricaEastern AsiaEastern EuropeEcuadorEgyptEl SalvadorEnglandEritreaEthiopiaEuropeFijiFranceGermanyGhanaGreeceGrenadaGuatemalaGuyanaHaitiHondurasHong KongHungaryIndiaIndonesiaIranIraqIrelandIsraelItalyJamaicaJapanJordanKazakhstanKenyaKoreaKuwaitLaosLatin AmericaLatviaLebanonLiberiaLithuaniaMalaysiaMexicoMicronesiaMiddle AfricaMoldovaMoroccoNepalNetherlandsNicaraguaNigeriaNorth AmericaNorth MacedoniaNorthern AfricaNorthern EuropeNorwayOceaniaPakistanPanamaPeruPhilippinesPolandPortugalRomaniaRussiaSaudi ArabiaScotlandSenegalSerbiaSierra LeoneSingaporeSomaliaSouth AfricaSouth AmericaSouth Central AsiaSouth Eastern AsiaSouthern EuropeSpainSri LankaSt. Vincent and the GrenadinesSudanSwedenSwitzerlandSyriaTaiwanThailandTrinidad and TobagoTurkeyUgandaUkraineUruguayUzbekistanVenezuelaVietnamWest IndiesWestern AfricaWestern AsiaWestern EuropeYemenZaireZimbabweAzores
Indian (Asian)
Race
Ancestry
AfghanAfricanAlaska NativeAlaskan AthabascanAlbanianAleutAlsatianAmericanApacheArabArapahoArgentineanArmenianAssyrian/Chaldean/SyriacAustralianAustrianBahamianBangladeshiBarbadianBasqueBelgianBelizeanBermudanBhutaneseBlackfeetBolivianBrazilianBritishBritish West IndianBulgarianBurmeseCajunCambodianCanadianCape VerdeanCarpatho RusynCelticCentral AmericanCentral American IndianCherokeeCheyenneChickasawChileanChineseChippewaChoctawColombianColvilleComancheCosta RicanCreeCreekCroatianCrowCubanCypriotCzechCzechoslovakianDanishDelawareDominicanDutchDutch West IndianEastern EuropeanEcuadorianEgyptianEnglishEstonianEthiopianEuropeanFijianFilipinoFinnishFrenchFrench American IndianFrench CanadianGermanGerman RussianGhanaianGreekGuamanian/ChamorroGuatemalanGuyaneseHaitianHmongHonduranHopiHoumaHungarianIcelanderIndian (Asian)IndonesianInupiatIranianIraqiIrishIroquoisIsraeliItalianJamaicanJapaneseJordanianKenyanKiowaKoreanLaotianLatvianLebaneseLiberianLithuanianLumbeeLuxembourgerMacedonianMalaysianMalteseMarshalleseMenomineeMexicanMexican American IndianMongolianMoroccanNative HawaiianNavajoNepaleseNew ZealanderNicaraguanNigerianNorthern EuropeanNorwegianOkinawanOsageOttawaPaiutePakistaniPanamanianParaguayanPennsylvania GermanPeruvianPimaPolishPortuguesePotawatomiPuebloPuerto RicanPuget Sound SalishRomanianRussianSalvadoranSamoanScandinavianScotch-IrishScottishSeminoleSenegaleseSerbianShoshoneSierra LeoneanSiouxSlavicSlovakSloveneSomaliSouth AfricanSouth AmericanSouth American IndianSoviet UnionSpaniardSpanishSpanish AmericanSpanish American IndianSri LankanSubsaharan AfricanSudaneseSwedishSwissSyrianTaiwaneseThaiTlingit-HaidaTohono O'OdhamTonganTrinidadian and TobagonianTsimshianTurkishU.S. Virgin IslanderUgandanUkrainianUruguayanUteVenezuelanVietnameseWelshWest IndianYakamaYaquiYugoslavianYumanYup'ikZimbabwean
Immigration
NonimmigrantsImmigrantsAfghanistanAfricaAlbaniaArgentinaArmeniaAsiaAustraliaAustriaBahamasBangladeshBarbadosBelarusBelgiumBelizeBoliviaBosnia and HerzegovinaBrazilBulgariaBurma/MyanmarCabo VerdeCambodiaCameroonCanadaCaribbeanCentral AmericaChileChinaColombiaCongoCosta RicaCroatiaCubaCzechoslovakiaDenmarkDominicaDominican RepublicEastern AfricaEastern AsiaEastern EuropeEcuadorEgyptEl SalvadorEnglandEritreaEthiopiaEuropeFijiFranceGermanyGhanaGreeceGrenadaGuatemalaGuyanaHaitiHondurasHong KongHungaryIndiaIndonesiaIranIraqIrelandIsraelItalyJamaicaJapanJordanKazakhstanKenyaKoreaKuwaitLaosLatin AmericaLatviaLebanonLiberiaLithuaniaMalaysiaMexicoMicronesiaMiddle AfricaMoldovaMoroccoNepalNetherlandsNicaraguaNigeriaNorth AmericaNorth MacedoniaNorthern AfricaNorthern EuropeNorwayOceaniaPakistanPanamaPeruPhilippinesPolandPortugalRomaniaRussiaSaudi ArabiaScotlandSenegalSerbiaSierra LeoneSingaporeSomaliaSouth AfricaSouth AmericaSouth Central AsiaSouth Eastern AsiaSouthern EuropeSpainSri LankaSt. Vincent and the GrenadinesSudanSwedenSwitzerlandSyriaTaiwanThailandTrinidad and TobagoTurkeyUgandaUkraineUruguayUzbekistanVenezuelaVietnamWest IndiesWestern AfricaWestern AsiaWestern EuropeYemenZaireZimbabweAzores
Self-Care Disability
Income
Poverty
Unemployment
Labor Participation
Family Structure
Vehicle Availability
Education Level
Disability

Self-Care Disability Comparison

Palestinians

Indians (Asian)

Exceptional
Exceptional
2.3%
SELF-CARE DISABILITY
99.4/ 100
METRIC RATING
61st/ 347
METRIC RANK
2.3%
SELF-CARE DISABILITY
98.7/ 100
METRIC RATING
83rd/ 347
METRIC RANK

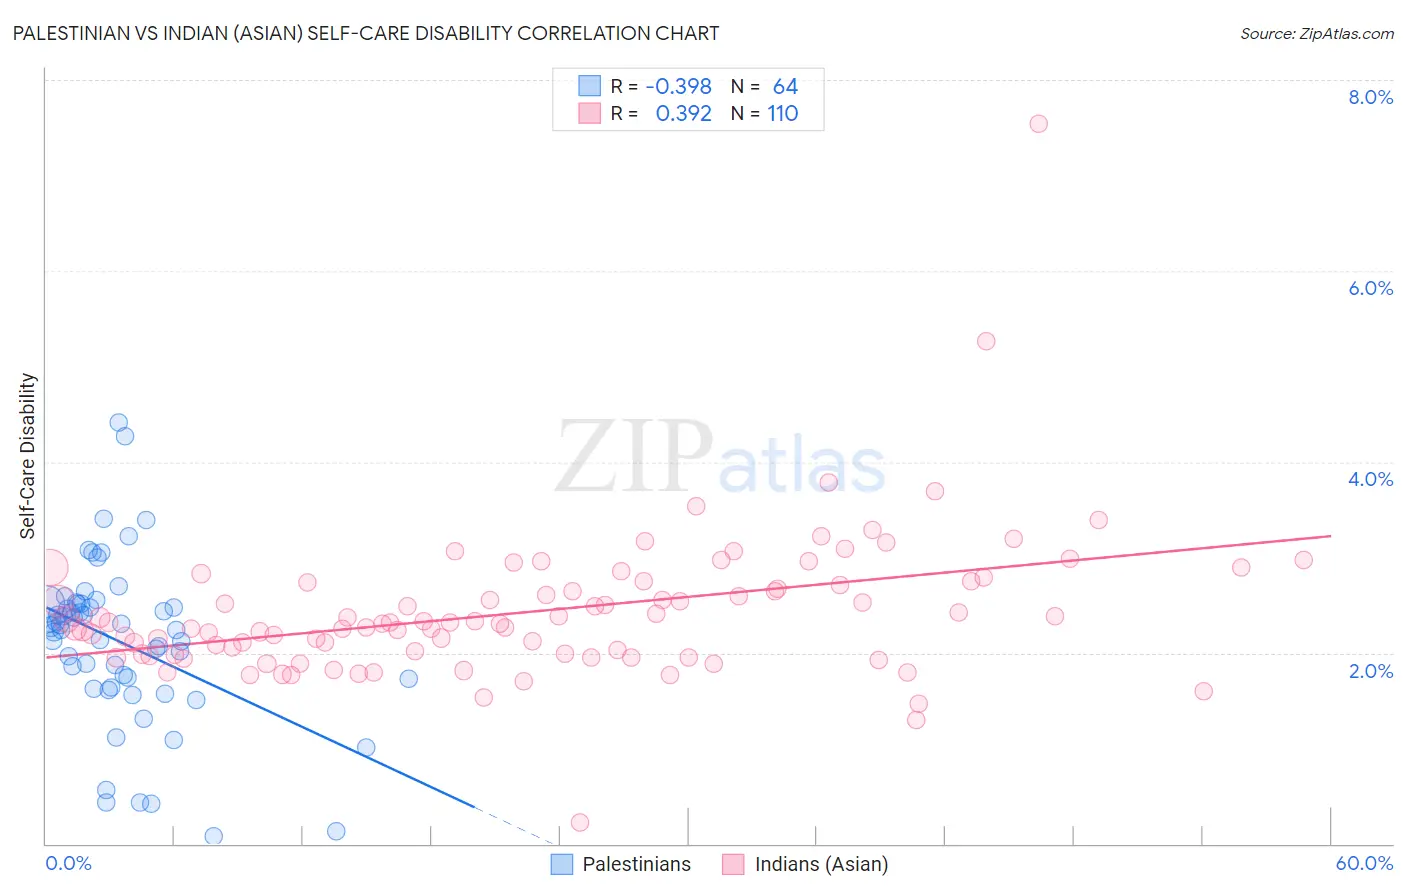
Palestinian vs Indian (Asian) Self-Care Disability Correlation Chart

The statistical analysis conducted on geographies consisting of 216,359,093 people shows a mild negative correlation between the proportion of Palestinians and percentage of population with self-care disability in the United States with a correlation coefficient (R) of -0.398 and weighted average of 2.3%. Similarly, the statistical analysis conducted on geographies consisting of 494,223,906 people shows a mild positive correlation between the proportion of Indians (Asian) and percentage of population with self-care disability in the United States with a correlation coefficient (R) of 0.392 and weighted average of 2.3%, a difference of 1.1%.
Palestinian vs Indian (Asian) Self-Care Disability

Self-Care Disability Correlation Summary

MeasurementPalestinianIndian (Asian)
Minimum0.076%0.22%
Maximum4.4%7.5%
Range4.3%7.3%
Mean2.1%2.4%
Median2.3%2.3%
Interquartile 25% (IQ1)1.7%2.0%
Interquartile 75% (IQ3)2.5%2.7%
Interquartile Range (IQR)0.83%0.76%
Standard Deviation (Sample)0.86%0.78%
Standard Deviation (Population)0.85%0.77%

Similar Demographics by Self-Care Disability

Demographics Similar to Palestinians by Self-Care Disability

In terms of self-care disability, the demographic groups most similar to Palestinians are Egyptian (2.3%, a difference of 0.090%), Immigrants from Japan (2.3%, a difference of 0.10%), Mongolian (2.3%, a difference of 0.18%), Swedish (2.3%, a difference of 0.18%), and New Zealander (2.3%, a difference of 0.24%).
DemographicsRating | RankSelf-Care Disability
Argentineans
99.6
/100
|
#54
Exceptional
2.3%
Immigrants | France
99.6
/100
|
#55
Exceptional
2.3%
Immigrants | Eastern Asia
99.6
/100
|
#56
Exceptional
2.3%
Immigrants | Belgium
99.6
/100
|
#57
Exceptional
2.3%
Immigrants | Cameroon
99.6
/100
|
#58
Exceptional
2.3%
New Zealanders
99.5
/100
|
#59
Exceptional
2.3%
Immigrants | Japan
99.5
/100
|
#60
Exceptional
2.3%
Palestinians
99.4
/100
|
#61
Exceptional
2.3%
Egyptians
99.4
/100
|
#62
Exceptional
2.3%
Mongolians
99.3
/100
|
#63
Exceptional
2.3%
Swedes
99.3
/100
|
#64
Exceptional
2.3%
Brazilians
99.3
/100
|
#65
Exceptional
2.3%
Immigrants | Argentina
99.3
/100
|
#66
Exceptional
2.3%
South Africans
99.3
/100
|
#67
Exceptional
2.3%
Immigrants | Zaire
99.2
/100
|
#68
Exceptional
2.3%

Demographics Similar to Indians (Asian) by Self-Care Disability

In terms of self-care disability, the demographic groups most similar to Indians (Asian) are Immigrants from Spain (2.3%, a difference of 0.040%), Ugandan (2.3%, a difference of 0.070%), Immigrants from Denmark (2.3%, a difference of 0.070%), Chilean (2.3%, a difference of 0.14%), and Immigrants from Middle Africa (2.3%, a difference of 0.33%).
DemographicsRating | RankSelf-Care Disability
Immigrants | China
99.1
/100
|
#76
Exceptional
2.3%
Immigrants | Middle Africa
99.0
/100
|
#77
Exceptional
2.3%
Immigrants | Ireland
99.0
/100
|
#78
Exceptional
2.3%
Immigrants | Kenya
99.0
/100
|
#79
Exceptional
2.3%
Chileans
98.8
/100
|
#80
Exceptional
2.3%
Ugandans
98.8
/100
|
#81
Exceptional
2.3%
Immigrants | Denmark
98.8
/100
|
#82
Exceptional
2.3%
Indians (Asian)
98.7
/100
|
#83
Exceptional
2.3%
Immigrants | Spain
98.7
/100
|
#84
Exceptional
2.3%
Estonians
98.3
/100
|
#85
Exceptional
2.3%
Immigrants | Northern Africa
98.2
/100
|
#86
Exceptional
2.3%
Sierra Leoneans
98.0
/100
|
#87
Exceptional
2.4%
Lithuanians
98.0
/100
|
#88
Exceptional
2.4%
Immigrants | Congo
98.0
/100
|
#89
Exceptional
2.4%
Immigrants | Czechoslovakia
97.7
/100
|
#90
Exceptional
2.4%