Palestinian vs Indian (Asian) Male Unemployment
COMPARE
Palestinian
Indian (Asian)
Male Unemployment
Male Unemployment Comparison
Palestinians
Indians (Asian)
5.1%
MALE UNEMPLOYMENT
87.7/ 100
METRIC RATING
123rd/ 347
METRIC RANK
5.2%
MALE UNEMPLOYMENT
76.0/ 100
METRIC RATING
150th/ 347
METRIC RANK
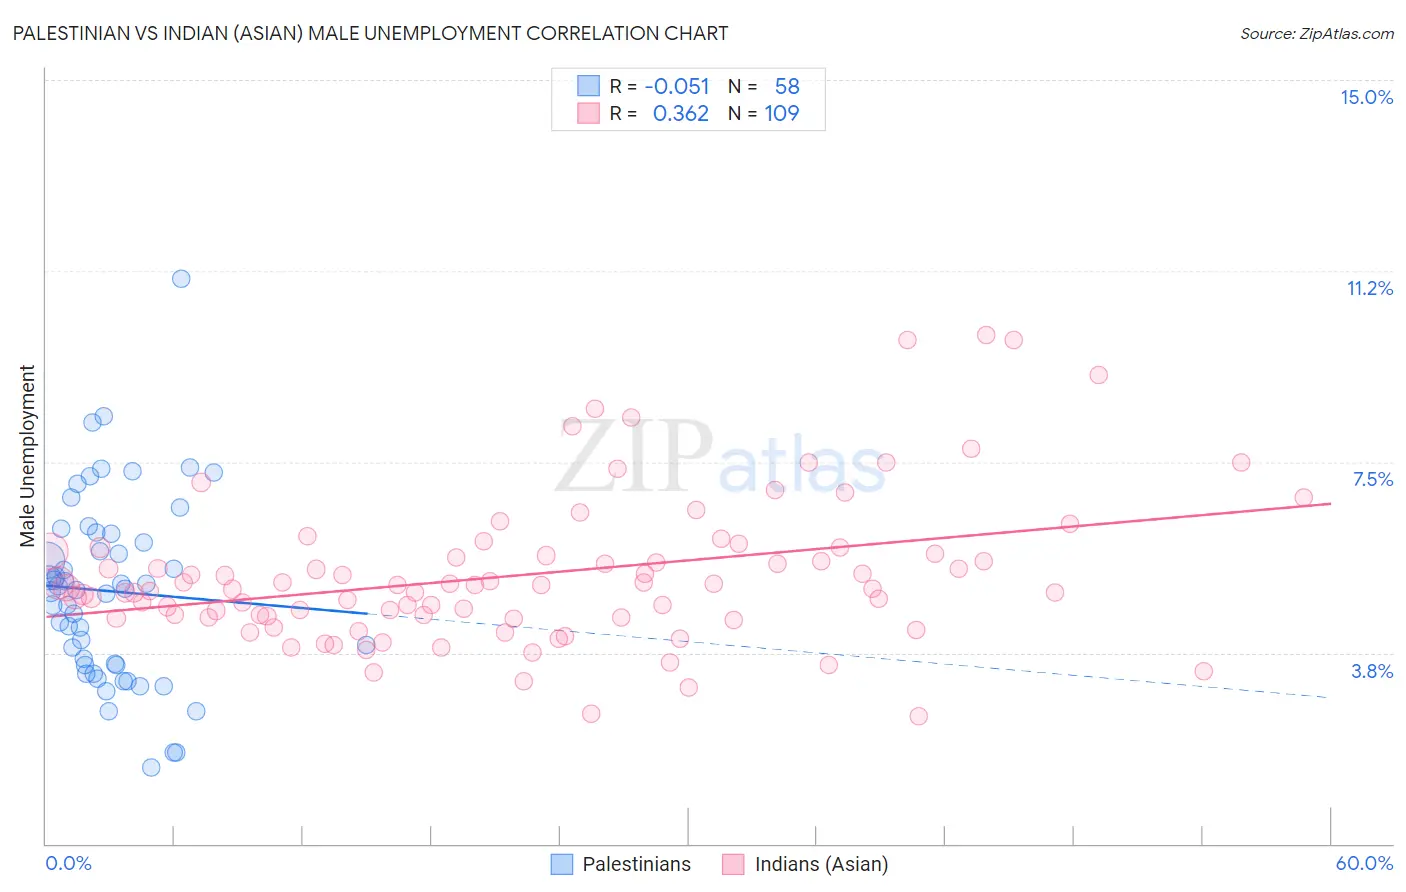
Palestinian vs Indian (Asian) Male Unemployment Correlation Chart
The statistical analysis conducted on geographies consisting of 216,271,128 people shows a slight negative correlation between the proportion of Palestinians and unemployment rate among males in the United States with a correlation coefficient (R) of -0.051 and weighted average of 5.1%. Similarly, the statistical analysis conducted on geographies consisting of 491,822,347 people shows a mild positive correlation between the proportion of Indians (Asian) and unemployment rate among males in the United States with a correlation coefficient (R) of 0.362 and weighted average of 5.2%, a difference of 1.2%.
Male Unemployment Correlation Summary
| Measurement | Palestinian | Indian (Asian) |
| Minimum | 1.5% | 2.5% |
| Maximum | 11.1% | 10.0% |
| Range | 9.6% | 7.5% |
| Mean | 5.0% | 5.3% |
| Median | 5.0% | 5.0% |
| Interquartile 25% (IQ1) | 3.5% | 4.4% |
| Interquartile 75% (IQ3) | 6.1% | 5.7% |
| Interquartile Range (IQR) | 2.6% | 1.3% |
| Standard Deviation (Sample) | 1.8% | 1.5% |
| Standard Deviation (Population) | 1.8% | 1.4% |
Similar Demographics by Male Unemployment
Demographics Similar to Palestinians by Male Unemployment
In terms of male unemployment, the demographic groups most similar to Palestinians are Immigrants from Latvia (5.1%, a difference of 0.030%), Nicaraguan (5.1%, a difference of 0.070%), Immigrants from Lithuania (5.1%, a difference of 0.070%), Mongolian (5.1%, a difference of 0.10%), and Ukrainian (5.1%, a difference of 0.11%).
| Demographics | Rating | Rank | Male Unemployment |
| Immigrants | Denmark | 89.4 /100 | #116 | Excellent 5.1% |
| Estonians | 89.0 /100 | #117 | Excellent 5.1% |
| Cypriots | 88.8 /100 | #118 | Excellent 5.1% |
| French Canadians | 88.6 /100 | #119 | Excellent 5.1% |
| Ukrainians | 88.4 /100 | #120 | Excellent 5.1% |
| Mongolians | 88.4 /100 | #121 | Excellent 5.1% |
| Nicaraguans | 88.2 /100 | #122 | Excellent 5.1% |
| Palestinians | 87.7 /100 | #123 | Excellent 5.1% |
| Immigrants | Latvia | 87.5 /100 | #124 | Excellent 5.1% |
| Immigrants | Lithuania | 87.2 /100 | #125 | Excellent 5.1% |
| Immigrants | Colombia | 86.8 /100 | #126 | Excellent 5.1% |
| Immigrants | Brazil | 86.3 /100 | #127 | Excellent 5.2% |
| Hungarians | 85.1 /100 | #128 | Excellent 5.2% |
| Immigrants | Western Europe | 84.8 /100 | #129 | Excellent 5.2% |
| Immigrants | Malaysia | 83.5 /100 | #130 | Excellent 5.2% |
Demographics Similar to Indians (Asian) by Male Unemployment
In terms of male unemployment, the demographic groups most similar to Indians (Asian) are Immigrants from Europe (5.2%, a difference of 0.020%), Immigrants from Italy (5.2%, a difference of 0.030%), Slovak (5.2%, a difference of 0.040%), Egyptian (5.2%, a difference of 0.090%), and Immigrants from Burma/Myanmar (5.2%, a difference of 0.12%).
| Demographics | Rating | Rank | Male Unemployment |
| Syrians | 78.0 /100 | #143 | Good 5.2% |
| Sri Lankans | 77.9 /100 | #144 | Good 5.2% |
| Macedonians | 77.7 /100 | #145 | Good 5.2% |
| Immigrants | Kenya | 77.6 /100 | #146 | Good 5.2% |
| Immigrants | Burma/Myanmar | 77.5 /100 | #147 | Good 5.2% |
| Immigrants | Italy | 76.3 /100 | #148 | Good 5.2% |
| Immigrants | Europe | 76.2 /100 | #149 | Good 5.2% |
| Indians (Asian) | 76.0 /100 | #150 | Good 5.2% |
| Slovaks | 75.5 /100 | #151 | Good 5.2% |
| Egyptians | 74.8 /100 | #152 | Good 5.2% |
| Immigrants | Uruguay | 73.9 /100 | #153 | Good 5.2% |
| Laotians | 73.8 /100 | #154 | Good 5.2% |
| Immigrants | Hungary | 73.4 /100 | #155 | Good 5.2% |
| Americans | 72.7 /100 | #156 | Good 5.2% |
| Immigrants | Northern Africa | 72.3 /100 | #157 | Good 5.2% |