West Indian vs Indian (Asian) Self-Care Disability
COMPARE
West Indian
Indian (Asian)
Self-Care Disability
Self-Care Disability Comparison
West Indians
Indians (Asian)
2.8%
SELF-CARE DISABILITY
0.0/ 100
METRIC RATING
297th/ 347
METRIC RANK
2.3%
SELF-CARE DISABILITY
98.7/ 100
METRIC RATING
83rd/ 347
METRIC RANK
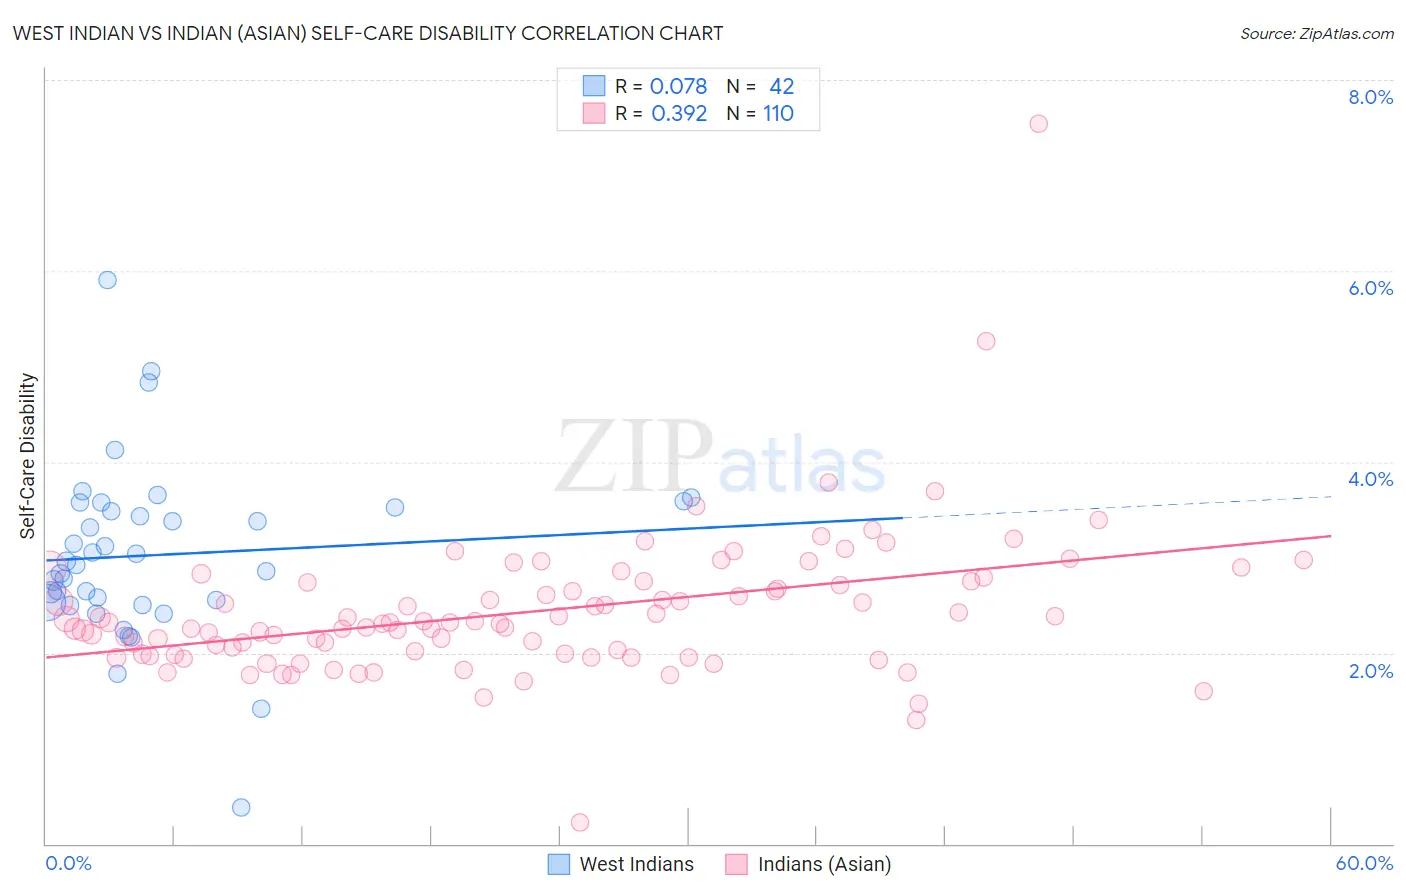
West Indian vs Indian (Asian) Self-Care Disability Correlation Chart
The statistical analysis conducted on geographies consisting of 253,805,677 people shows a slight positive correlation between the proportion of West Indians and percentage of population with self-care disability in the United States with a correlation coefficient (R) of 0.078 and weighted average of 2.8%. Similarly, the statistical analysis conducted on geographies consisting of 494,223,906 people shows a mild positive correlation between the proportion of Indians (Asian) and percentage of population with self-care disability in the United States with a correlation coefficient (R) of 0.392 and weighted average of 2.3%, a difference of 18.0%.
Self-Care Disability Correlation Summary
| Measurement | West Indian | Indian (Asian) |
| Minimum | 0.38% | 0.22% |
| Maximum | 5.9% | 7.5% |
| Range | 5.5% | 7.3% |
| Mean | 3.0% | 2.4% |
| Median | 2.9% | 2.3% |
| Interquartile 25% (IQ1) | 2.5% | 2.0% |
| Interquartile 75% (IQ3) | 3.5% | 2.7% |
| Interquartile Range (IQR) | 1.00% | 0.76% |
| Standard Deviation (Sample) | 0.93% | 0.78% |
| Standard Deviation (Population) | 0.92% | 0.77% |
Similar Demographics by Self-Care Disability
Demographics Similar to West Indians by Self-Care Disability
In terms of self-care disability, the demographic groups most similar to West Indians are Immigrants from Portugal (2.8%, a difference of 0.090%), American (2.8%, a difference of 0.12%), Immigrants from Guyana (2.8%, a difference of 0.21%), Barbadian (2.7%, a difference of 0.51%), and Central American Indian (2.7%, a difference of 0.66%).
| Demographics | Rating | Rank | Self-Care Disability |
| Cubans | 0.0 /100 | #290 | Tragic 2.7% |
| Guyanese | 0.0 /100 | #291 | Tragic 2.7% |
| Central American Indians | 0.0 /100 | #292 | Tragic 2.7% |
| Belizeans | 0.0 /100 | #293 | Tragic 2.7% |
| Blackfeet | 0.0 /100 | #294 | Tragic 2.7% |
| Barbadians | 0.0 /100 | #295 | Tragic 2.7% |
| Immigrants | Portugal | 0.0 /100 | #296 | Tragic 2.8% |
| West Indians | 0.0 /100 | #297 | Tragic 2.8% |
| Americans | 0.0 /100 | #298 | Tragic 2.8% |
| Immigrants | Guyana | 0.0 /100 | #299 | Tragic 2.8% |
| Immigrants | Fiji | 0.0 /100 | #300 | Tragic 2.8% |
| Pima | 0.0 /100 | #301 | Tragic 2.8% |
| Immigrants | St. Vincent and the Grenadines | 0.0 /100 | #302 | Tragic 2.8% |
| Immigrants | Belize | 0.0 /100 | #303 | Tragic 2.8% |
| Cree | 0.0 /100 | #304 | Tragic 2.8% |
Demographics Similar to Indians (Asian) by Self-Care Disability
In terms of self-care disability, the demographic groups most similar to Indians (Asian) are Immigrants from Spain (2.3%, a difference of 0.040%), Ugandan (2.3%, a difference of 0.070%), Immigrants from Denmark (2.3%, a difference of 0.070%), Chilean (2.3%, a difference of 0.14%), and Immigrants from Middle Africa (2.3%, a difference of 0.33%).
| Demographics | Rating | Rank | Self-Care Disability |
| Immigrants | China | 99.1 /100 | #76 | Exceptional 2.3% |
| Immigrants | Middle Africa | 99.0 /100 | #77 | Exceptional 2.3% |
| Immigrants | Ireland | 99.0 /100 | #78 | Exceptional 2.3% |
| Immigrants | Kenya | 99.0 /100 | #79 | Exceptional 2.3% |
| Chileans | 98.8 /100 | #80 | Exceptional 2.3% |
| Ugandans | 98.8 /100 | #81 | Exceptional 2.3% |
| Immigrants | Denmark | 98.8 /100 | #82 | Exceptional 2.3% |
| Indians (Asian) | 98.7 /100 | #83 | Exceptional 2.3% |
| Immigrants | Spain | 98.7 /100 | #84 | Exceptional 2.3% |
| Estonians | 98.3 /100 | #85 | Exceptional 2.3% |
| Immigrants | Northern Africa | 98.2 /100 | #86 | Exceptional 2.3% |
| Sierra Leoneans | 98.0 /100 | #87 | Exceptional 2.4% |
| Lithuanians | 98.0 /100 | #88 | Exceptional 2.4% |
| Immigrants | Congo | 98.0 /100 | #89 | Exceptional 2.4% |
| Immigrants | Czechoslovakia | 97.7 /100 | #90 | Exceptional 2.4% |