Palestinian vs Immigrants from Austria Self-Care Disability
COMPARE
Palestinian
Immigrants from Austria
Self-Care Disability
Self-Care Disability Comparison
Palestinians
Immigrants from Austria
2.3%
SELF-CARE DISABILITY
99.4/ 100
METRIC RATING
61st/ 347
METRIC RANK
2.4%
SELF-CARE DISABILITY
89.0/ 100
METRIC RATING
130th/ 347
METRIC RANK
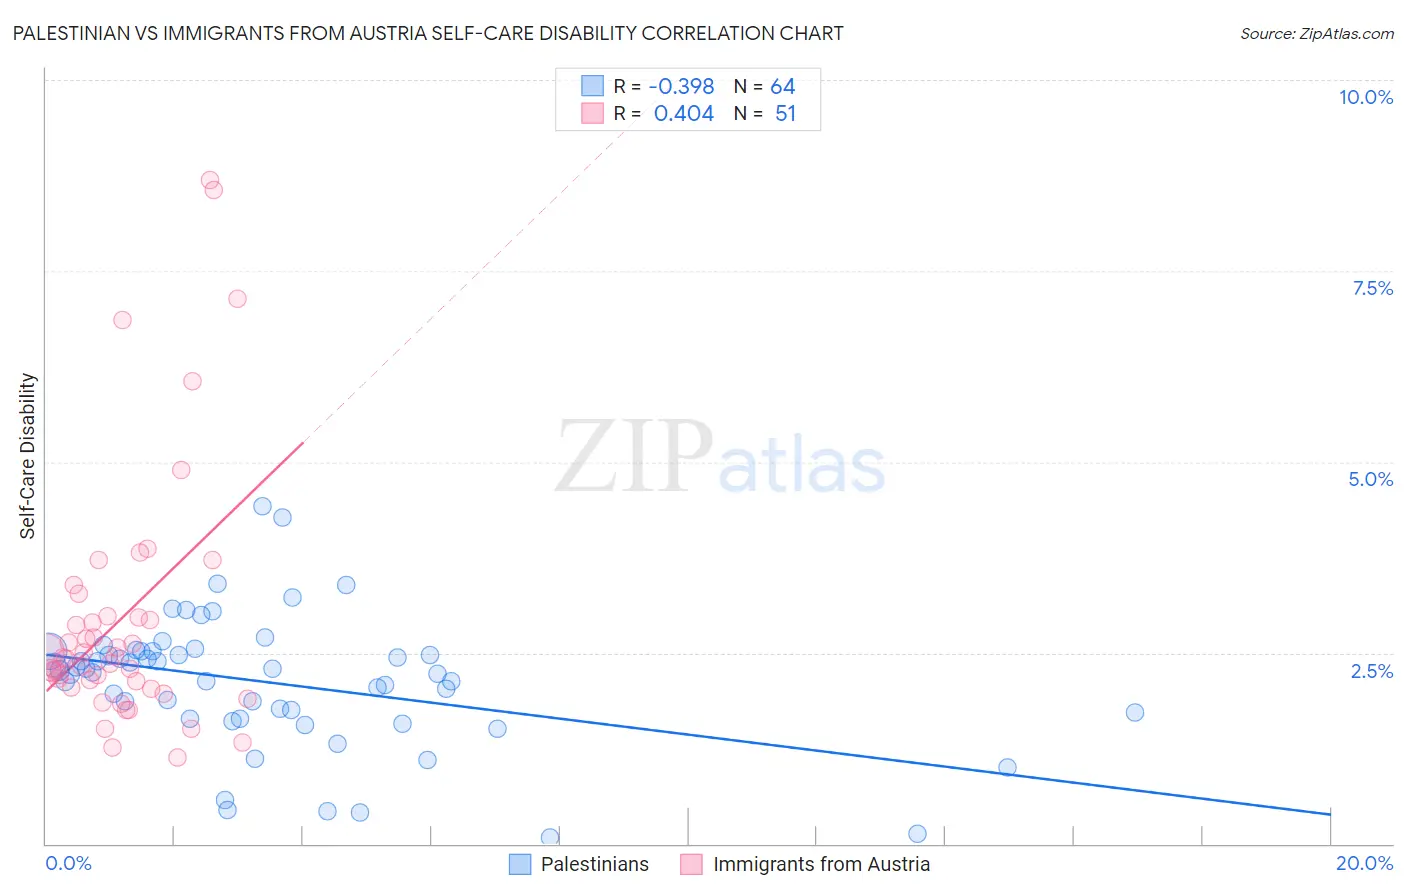
Palestinian vs Immigrants from Austria Self-Care Disability Correlation Chart
The statistical analysis conducted on geographies consisting of 216,359,093 people shows a mild negative correlation between the proportion of Palestinians and percentage of population with self-care disability in the United States with a correlation coefficient (R) of -0.398 and weighted average of 2.3%. Similarly, the statistical analysis conducted on geographies consisting of 167,909,652 people shows a moderate positive correlation between the proportion of Immigrants from Austria and percentage of population with self-care disability in the United States with a correlation coefficient (R) of 0.404 and weighted average of 2.4%, a difference of 3.9%.
Self-Care Disability Correlation Summary
| Measurement | Palestinian | Immigrants from Austria |
| Minimum | 0.076% | 1.1% |
| Maximum | 4.4% | 8.7% |
| Range | 4.3% | 7.6% |
| Mean | 2.1% | 3.0% |
| Median | 2.3% | 2.4% |
| Interquartile 25% (IQ1) | 1.7% | 2.0% |
| Interquartile 75% (IQ3) | 2.5% | 3.0% |
| Interquartile Range (IQR) | 0.83% | 0.94% |
| Standard Deviation (Sample) | 0.86% | 1.7% |
| Standard Deviation (Population) | 0.85% | 1.7% |
Similar Demographics by Self-Care Disability
Demographics Similar to Palestinians by Self-Care Disability
In terms of self-care disability, the demographic groups most similar to Palestinians are Egyptian (2.3%, a difference of 0.090%), Immigrants from Japan (2.3%, a difference of 0.10%), Mongolian (2.3%, a difference of 0.18%), Swedish (2.3%, a difference of 0.18%), and New Zealander (2.3%, a difference of 0.24%).
| Demographics | Rating | Rank | Self-Care Disability |
| Argentineans | 99.6 /100 | #54 | Exceptional 2.3% |
| Immigrants | France | 99.6 /100 | #55 | Exceptional 2.3% |
| Immigrants | Eastern Asia | 99.6 /100 | #56 | Exceptional 2.3% |
| Immigrants | Belgium | 99.6 /100 | #57 | Exceptional 2.3% |
| Immigrants | Cameroon | 99.6 /100 | #58 | Exceptional 2.3% |
| New Zealanders | 99.5 /100 | #59 | Exceptional 2.3% |
| Immigrants | Japan | 99.5 /100 | #60 | Exceptional 2.3% |
| Palestinians | 99.4 /100 | #61 | Exceptional 2.3% |
| Egyptians | 99.4 /100 | #62 | Exceptional 2.3% |
| Mongolians | 99.3 /100 | #63 | Exceptional 2.3% |
| Swedes | 99.3 /100 | #64 | Exceptional 2.3% |
| Brazilians | 99.3 /100 | #65 | Exceptional 2.3% |
| Immigrants | Argentina | 99.3 /100 | #66 | Exceptional 2.3% |
| South Africans | 99.3 /100 | #67 | Exceptional 2.3% |
| Immigrants | Zaire | 99.2 /100 | #68 | Exceptional 2.3% |
Demographics Similar to Immigrants from Austria by Self-Care Disability
In terms of self-care disability, the demographic groups most similar to Immigrants from Austria are Polish (2.4%, a difference of 0.020%), Immigrants from Romania (2.4%, a difference of 0.030%), Immigrants from South America (2.4%, a difference of 0.030%), Immigrants from Colombia (2.4%, a difference of 0.060%), and Colombian (2.4%, a difference of 0.080%).
| Demographics | Rating | Rank | Self-Care Disability |
| Immigrants | Nigeria | 90.3 /100 | #123 | Exceptional 2.4% |
| Immigrants | Morocco | 90.2 /100 | #124 | Exceptional 2.4% |
| Immigrants | North America | 90.2 /100 | #124 | Exceptional 2.4% |
| Hmong | 89.9 /100 | #126 | Excellent 2.4% |
| Colombians | 89.7 /100 | #127 | Excellent 2.4% |
| Immigrants | Hungary | 89.6 /100 | #128 | Excellent 2.4% |
| Immigrants | Romania | 89.3 /100 | #129 | Excellent 2.4% |
| Immigrants | Austria | 89.0 /100 | #130 | Excellent 2.4% |
| Poles | 88.9 /100 | #131 | Excellent 2.4% |
| Immigrants | South America | 88.8 /100 | #132 | Excellent 2.4% |
| Immigrants | Colombia | 88.5 /100 | #133 | Excellent 2.4% |
| Russians | 88.2 /100 | #134 | Excellent 2.4% |
| Laotians | 87.8 /100 | #135 | Excellent 2.4% |
| South American Indians | 87.2 /100 | #136 | Excellent 2.4% |
| Austrians | 87.0 /100 | #137 | Excellent 2.4% |