Pakistani vs Ugandan Vision Disability
COMPARE
Pakistani
Ugandan
Vision Disability
Vision Disability Comparison
Pakistanis
Ugandans
2.1%
VISION DISABILITY
71.6/ 100
METRIC RATING
156th/ 347
METRIC RANK
2.1%
VISION DISABILITY
92.2/ 100
METRIC RATING
116th/ 347
METRIC RANK
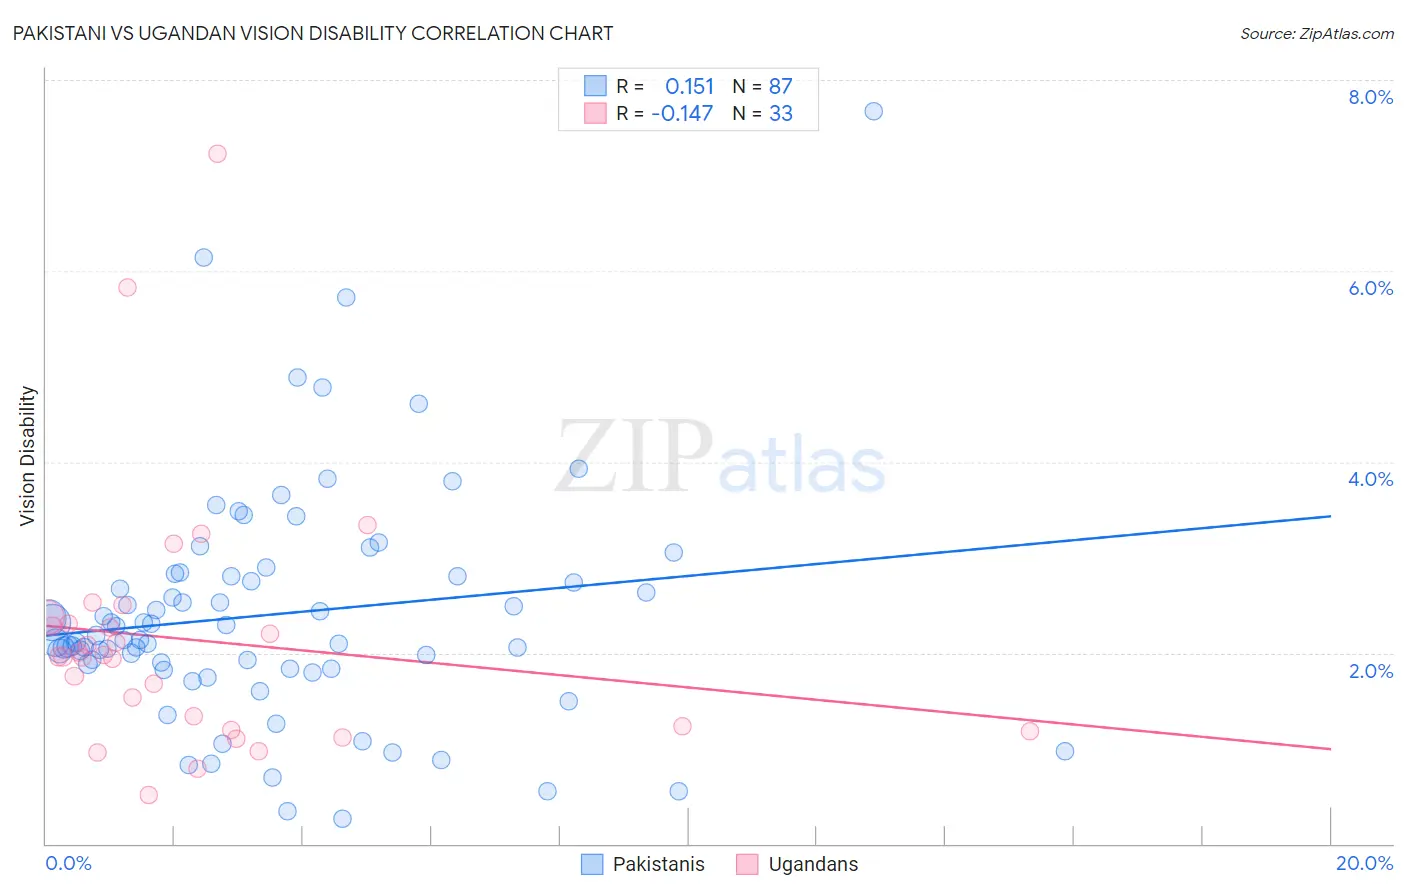
Pakistani vs Ugandan Vision Disability Correlation Chart
The statistical analysis conducted on geographies consisting of 335,131,498 people shows a poor positive correlation between the proportion of Pakistanis and percentage of population with vision disability in the United States with a correlation coefficient (R) of 0.151 and weighted average of 2.1%. Similarly, the statistical analysis conducted on geographies consisting of 94,002,961 people shows a poor negative correlation between the proportion of Ugandans and percentage of population with vision disability in the United States with a correlation coefficient (R) of -0.147 and weighted average of 2.1%, a difference of 2.5%.
Vision Disability Correlation Summary
| Measurement | Pakistani | Ugandan |
| Minimum | 0.26% | 0.51% |
| Maximum | 7.7% | 7.2% |
| Range | 7.4% | 6.7% |
| Mean | 2.4% | 2.1% |
| Median | 2.1% | 2.0% |
| Interquartile 25% (IQ1) | 1.8% | 1.2% |
| Interquartile 75% (IQ3) | 2.8% | 2.3% |
| Interquartile Range (IQR) | 0.96% | 1.1% |
| Standard Deviation (Sample) | 1.2% | 1.3% |
| Standard Deviation (Population) | 1.2% | 1.3% |
Similar Demographics by Vision Disability
Demographics Similar to Pakistanis by Vision Disability
In terms of vision disability, the demographic groups most similar to Pakistanis are Immigrants from Colombia (2.1%, a difference of 0.040%), Serbian (2.1%, a difference of 0.11%), Immigrants from Uzbekistan (2.1%, a difference of 0.13%), South African (2.1%, a difference of 0.14%), and Slovene (2.1%, a difference of 0.16%).
| Demographics | Rating | Rank | Vision Disability |
| Colombians | 76.2 /100 | #149 | Good 2.1% |
| Belgians | 75.9 /100 | #150 | Good 2.1% |
| Immigrants | Norway | 75.5 /100 | #151 | Good 2.1% |
| Immigrants | Southern Europe | 74.6 /100 | #152 | Good 2.1% |
| Immigrants | South America | 73.8 /100 | #153 | Good 2.1% |
| Slovenes | 73.6 /100 | #154 | Good 2.1% |
| Immigrants | Colombia | 72.1 /100 | #155 | Good 2.1% |
| Pakistanis | 71.6 /100 | #156 | Good 2.1% |
| Serbians | 70.2 /100 | #157 | Good 2.1% |
| Immigrants | Uzbekistan | 69.9 /100 | #158 | Good 2.1% |
| South Africans | 69.8 /100 | #159 | Good 2.1% |
| Austrians | 69.0 /100 | #160 | Good 2.1% |
| Iraqis | 67.7 /100 | #161 | Good 2.1% |
| Hungarians | 67.4 /100 | #162 | Good 2.1% |
| Icelanders | 66.1 /100 | #163 | Good 2.1% |
Demographics Similar to Ugandans by Vision Disability
In terms of vision disability, the demographic groups most similar to Ugandans are Immigrants from Vietnam (2.1%, a difference of 0.0%), Croatian (2.1%, a difference of 0.030%), Polish (2.1%, a difference of 0.040%), Kenyan (2.1%, a difference of 0.060%), and Immigrants from Denmark (2.1%, a difference of 0.18%).
| Demographics | Rating | Rank | Vision Disability |
| Chileans | 94.0 /100 | #109 | Exceptional 2.1% |
| Immigrants | Armenia | 93.8 /100 | #110 | Exceptional 2.1% |
| Peruvians | 93.5 /100 | #111 | Exceptional 2.1% |
| Immigrants | Denmark | 92.9 /100 | #112 | Exceptional 2.1% |
| Kenyans | 92.5 /100 | #113 | Exceptional 2.1% |
| Croatians | 92.3 /100 | #114 | Exceptional 2.1% |
| Immigrants | Vietnam | 92.2 /100 | #115 | Exceptional 2.1% |
| Ugandans | 92.2 /100 | #116 | Exceptional 2.1% |
| Poles | 92.0 /100 | #117 | Exceptional 2.1% |
| Immigrants | Philippines | 91.4 /100 | #118 | Exceptional 2.1% |
| Immigrants | Uganda | 91.4 /100 | #119 | Exceptional 2.1% |
| Immigrants | Zimbabwe | 91.0 /100 | #120 | Exceptional 2.1% |
| Immigrants | Scotland | 90.4 /100 | #121 | Exceptional 2.1% |
| Immigrants | Ukraine | 90.4 /100 | #122 | Exceptional 2.1% |
| Immigrants | Albania | 90.4 /100 | #123 | Exceptional 2.1% |