Pakistani vs Central American Vision Disability
COMPARE
Pakistani
Central American
Vision Disability
Vision Disability Comparison
Pakistanis
Central Americans
2.1%
VISION DISABILITY
71.6/ 100
METRIC RATING
156th/ 347
METRIC RANK
2.3%
VISION DISABILITY
1.8/ 100
METRIC RATING
233rd/ 347
METRIC RANK
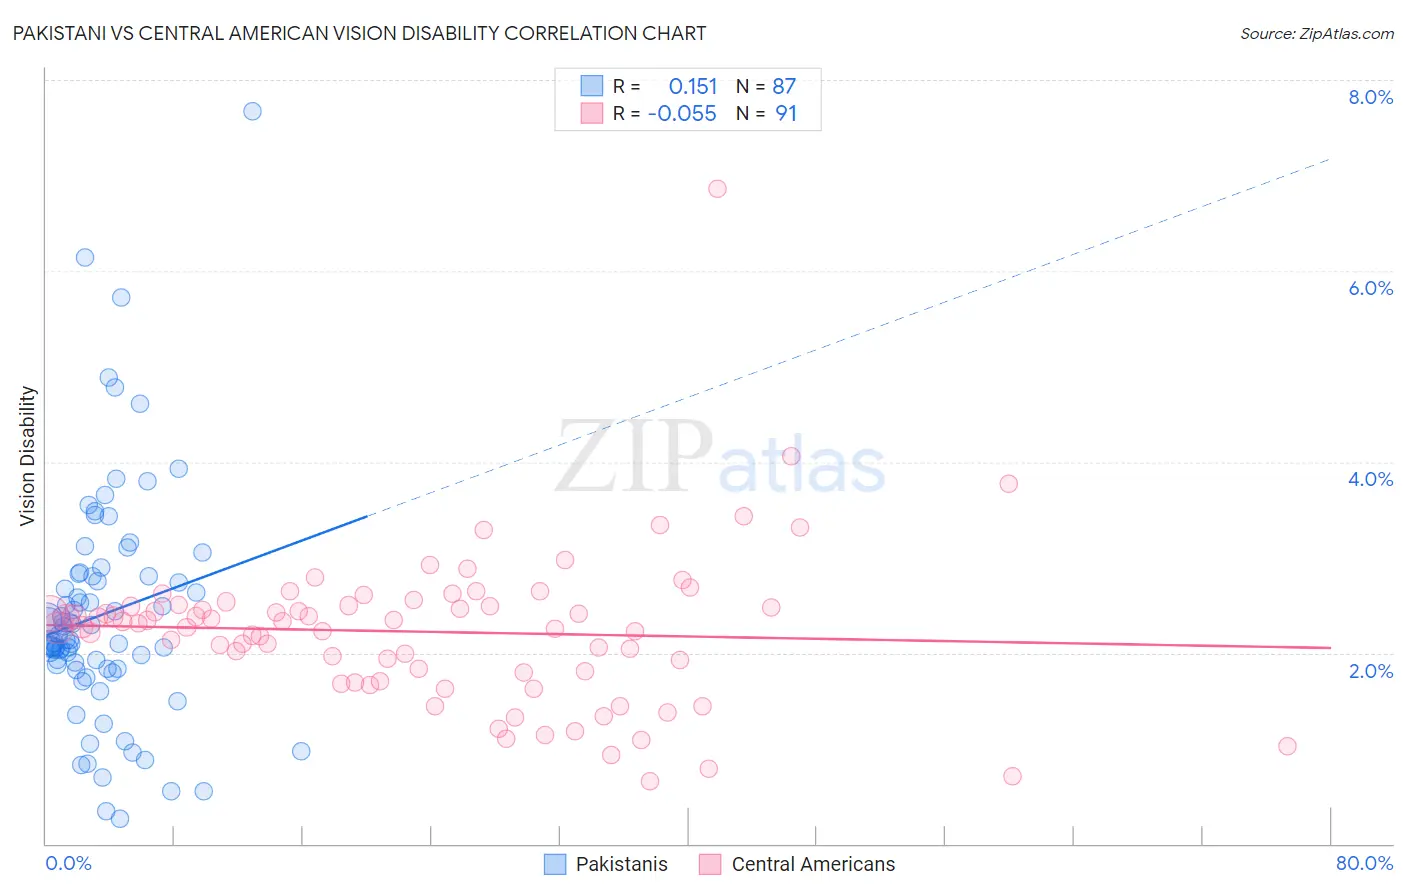
Pakistani vs Central American Vision Disability Correlation Chart
The statistical analysis conducted on geographies consisting of 335,131,498 people shows a poor positive correlation between the proportion of Pakistanis and percentage of population with vision disability in the United States with a correlation coefficient (R) of 0.151 and weighted average of 2.1%. Similarly, the statistical analysis conducted on geographies consisting of 503,926,566 people shows a slight negative correlation between the proportion of Central Americans and percentage of population with vision disability in the United States with a correlation coefficient (R) of -0.055 and weighted average of 2.3%, a difference of 7.9%.
Vision Disability Correlation Summary
| Measurement | Pakistani | Central American |
| Minimum | 0.26% | 0.66% |
| Maximum | 7.7% | 6.9% |
| Range | 7.4% | 6.2% |
| Mean | 2.4% | 2.2% |
| Median | 2.1% | 2.3% |
| Interquartile 25% (IQ1) | 1.8% | 1.8% |
| Interquartile 75% (IQ3) | 2.8% | 2.5% |
| Interquartile Range (IQR) | 0.96% | 0.71% |
| Standard Deviation (Sample) | 1.2% | 0.81% |
| Standard Deviation (Population) | 1.2% | 0.81% |
Similar Demographics by Vision Disability
Demographics Similar to Pakistanis by Vision Disability
In terms of vision disability, the demographic groups most similar to Pakistanis are Immigrants from Colombia (2.1%, a difference of 0.040%), Serbian (2.1%, a difference of 0.11%), Immigrants from Uzbekistan (2.1%, a difference of 0.13%), South African (2.1%, a difference of 0.14%), and Slovene (2.1%, a difference of 0.16%).
| Demographics | Rating | Rank | Vision Disability |
| Colombians | 76.2 /100 | #149 | Good 2.1% |
| Belgians | 75.9 /100 | #150 | Good 2.1% |
| Immigrants | Norway | 75.5 /100 | #151 | Good 2.1% |
| Immigrants | Southern Europe | 74.6 /100 | #152 | Good 2.1% |
| Immigrants | South America | 73.8 /100 | #153 | Good 2.1% |
| Slovenes | 73.6 /100 | #154 | Good 2.1% |
| Immigrants | Colombia | 72.1 /100 | #155 | Good 2.1% |
| Pakistanis | 71.6 /100 | #156 | Good 2.1% |
| Serbians | 70.2 /100 | #157 | Good 2.1% |
| Immigrants | Uzbekistan | 69.9 /100 | #158 | Good 2.1% |
| South Africans | 69.8 /100 | #159 | Good 2.1% |
| Austrians | 69.0 /100 | #160 | Good 2.1% |
| Iraqis | 67.7 /100 | #161 | Good 2.1% |
| Hungarians | 67.4 /100 | #162 | Good 2.1% |
| Icelanders | 66.1 /100 | #163 | Good 2.1% |
Demographics Similar to Central Americans by Vision Disability
In terms of vision disability, the demographic groups most similar to Central Americans are German Russian (2.3%, a difference of 0.020%), Scottish (2.3%, a difference of 0.18%), Immigrants from Ecuador (2.3%, a difference of 0.20%), Marshallese (2.3%, a difference of 0.25%), and Immigrants from Congo (2.3%, a difference of 0.34%).
| Demographics | Rating | Rank | Vision Disability |
| Immigrants | Germany | 3.0 /100 | #226 | Tragic 2.3% |
| Hawaiians | 2.9 /100 | #227 | Tragic 2.3% |
| Hmong | 2.5 /100 | #228 | Tragic 2.3% |
| Welsh | 2.3 /100 | #229 | Tragic 2.3% |
| Nicaraguans | 2.2 /100 | #230 | Tragic 2.3% |
| Immigrants | Ecuador | 2.0 /100 | #231 | Tragic 2.3% |
| German Russians | 1.8 /100 | #232 | Tragic 2.3% |
| Central Americans | 1.8 /100 | #233 | Tragic 2.3% |
| Scottish | 1.6 /100 | #234 | Tragic 2.3% |
| Marshallese | 1.5 /100 | #235 | Tragic 2.3% |
| Immigrants | Congo | 1.4 /100 | #236 | Tragic 2.3% |
| Immigrants | Portugal | 1.4 /100 | #237 | Tragic 2.3% |
| Immigrants | Cambodia | 1.1 /100 | #238 | Tragic 2.3% |
| English | 1.1 /100 | #239 | Tragic 2.3% |
| Panamanians | 0.9 /100 | #240 | Tragic 2.3% |