Ottawa vs Immigrants from Eastern Europe Male Disability
COMPARE
Ottawa
Immigrants from Eastern Europe
Male Disability
Male Disability Comparison
Ottawa
Immigrants from Eastern Europe
14.1%
MALE DISABILITY
0.0/ 100
METRIC RATING
325th/ 347
METRIC RANK
10.7%
MALE DISABILITY
95.3/ 100
METRIC RATING
102nd/ 347
METRIC RANK
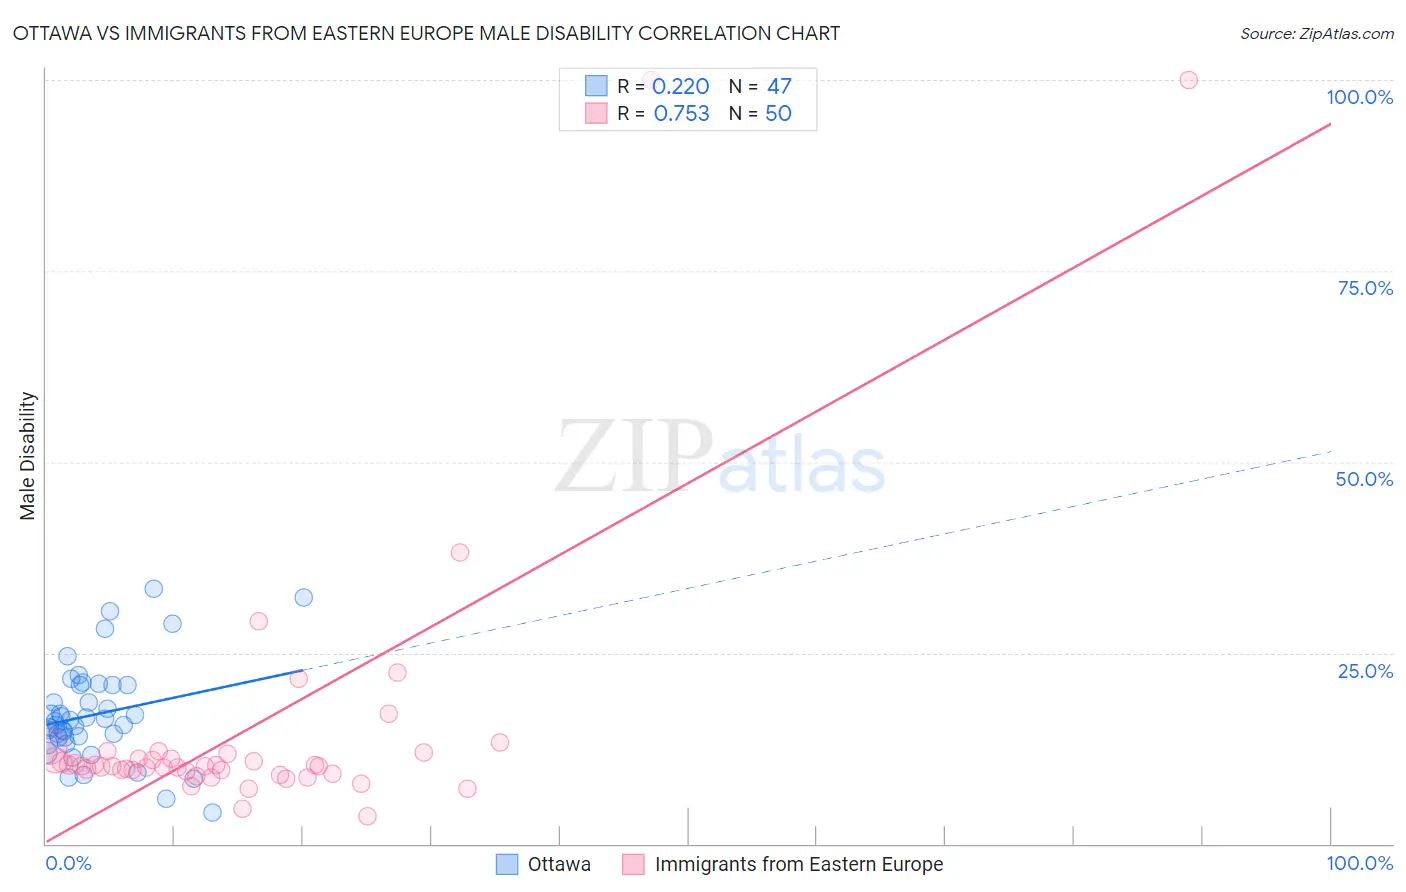
Ottawa vs Immigrants from Eastern Europe Male Disability Correlation Chart
The statistical analysis conducted on geographies consisting of 49,955,365 people shows a weak positive correlation between the proportion of Ottawa and percentage of males with a disability in the United States with a correlation coefficient (R) of 0.220 and weighted average of 14.1%. Similarly, the statistical analysis conducted on geographies consisting of 475,764,615 people shows a strong positive correlation between the proportion of Immigrants from Eastern Europe and percentage of males with a disability in the United States with a correlation coefficient (R) of 0.753 and weighted average of 10.7%, a difference of 30.9%.
Male Disability Correlation Summary
| Measurement | Ottawa | Immigrants from Eastern Europe |
| Minimum | 4.1% | 3.6% |
| Maximum | 33.3% | 100.0% |
| Range | 29.3% | 96.4% |
| Mean | 16.9% | 15.0% |
| Median | 16.0% | 10.2% |
| Interquartile 25% (IQ1) | 13.9% | 9.6% |
| Interquartile 75% (IQ3) | 20.7% | 11.8% |
| Interquartile Range (IQR) | 6.8% | 2.3% |
| Standard Deviation (Sample) | 6.4% | 18.4% |
| Standard Deviation (Population) | 6.3% | 18.2% |
Similar Demographics by Male Disability
Demographics Similar to Ottawa by Male Disability
In terms of male disability, the demographic groups most similar to Ottawa are Comanche (14.1%, a difference of 0.11%), Osage (14.0%, a difference of 0.44%), Apache (14.0%, a difference of 0.51%), Native/Alaskan (14.2%, a difference of 0.94%), and Potawatomi (14.2%, a difference of 1.1%).
| Demographics | Rating | Rank | Male Disability |
| Cree | 0.0 /100 | #318 | Tragic 13.7% |
| Americans | 0.0 /100 | #319 | Tragic 13.8% |
| Tlingit-Haida | 0.0 /100 | #320 | Tragic 13.8% |
| Shoshone | 0.0 /100 | #321 | Tragic 13.8% |
| Apache | 0.0 /100 | #322 | Tragic 14.0% |
| Osage | 0.0 /100 | #323 | Tragic 14.0% |
| Comanche | 0.0 /100 | #324 | Tragic 14.1% |
| Ottawa | 0.0 /100 | #325 | Tragic 14.1% |
| Natives/Alaskans | 0.0 /100 | #326 | Tragic 14.2% |
| Potawatomi | 0.0 /100 | #327 | Tragic 14.2% |
| Chippewa | 0.0 /100 | #328 | Tragic 14.3% |
| Cajuns | 0.0 /100 | #329 | Tragic 14.4% |
| Navajo | 0.0 /100 | #330 | Tragic 14.4% |
| Tohono O'odham | 0.0 /100 | #331 | Tragic 14.6% |
| Seminole | 0.0 /100 | #332 | Tragic 14.7% |
Demographics Similar to Immigrants from Eastern Europe by Male Disability
In terms of male disability, the demographic groups most similar to Immigrants from Eastern Europe are Uruguayan (10.7%, a difference of 0.010%), Immigrants from Nigeria (10.8%, a difference of 0.080%), Immigrants from Brazil (10.8%, a difference of 0.090%), Immigrants from Greece (10.7%, a difference of 0.10%), and Immigrants from Syria (10.8%, a difference of 0.13%).
| Demographics | Rating | Rank | Male Disability |
| Chileans | 96.9 /100 | #95 | Exceptional 10.7% |
| Nicaraguans | 96.6 /100 | #96 | Exceptional 10.7% |
| Immigrants | Armenia | 96.6 /100 | #97 | Exceptional 10.7% |
| Immigrants | Romania | 96.5 /100 | #98 | Exceptional 10.7% |
| Immigrants | Switzerland | 96.1 /100 | #99 | Exceptional 10.7% |
| Immigrants | Kazakhstan | 95.9 /100 | #100 | Exceptional 10.7% |
| Immigrants | Greece | 95.6 /100 | #101 | Exceptional 10.7% |
| Immigrants | Eastern Europe | 95.3 /100 | #102 | Exceptional 10.7% |
| Uruguayans | 95.3 /100 | #103 | Exceptional 10.7% |
| Immigrants | Nigeria | 95.1 /100 | #104 | Exceptional 10.8% |
| Immigrants | Brazil | 95.0 /100 | #105 | Exceptional 10.8% |
| Immigrants | Syria | 94.9 /100 | #106 | Exceptional 10.8% |
| Immigrants | Eastern Africa | 94.3 /100 | #107 | Exceptional 10.8% |
| Immigrants | Belgium | 94.2 /100 | #108 | Exceptional 10.8% |
| Immigrants | Uganda | 94.0 /100 | #109 | Exceptional 10.8% |