Ottawa vs Immigrants from Sri Lanka Male Disability
COMPARE
Ottawa
Immigrants from Sri Lanka
Male Disability
Male Disability Comparison
Ottawa
Immigrants from Sri Lanka
14.1%
MALE DISABILITY
0.0/ 100
METRIC RATING
325th/ 347
METRIC RANK
10.0%
MALE DISABILITY
100.0/ 100
METRIC RATING
19th/ 347
METRIC RANK
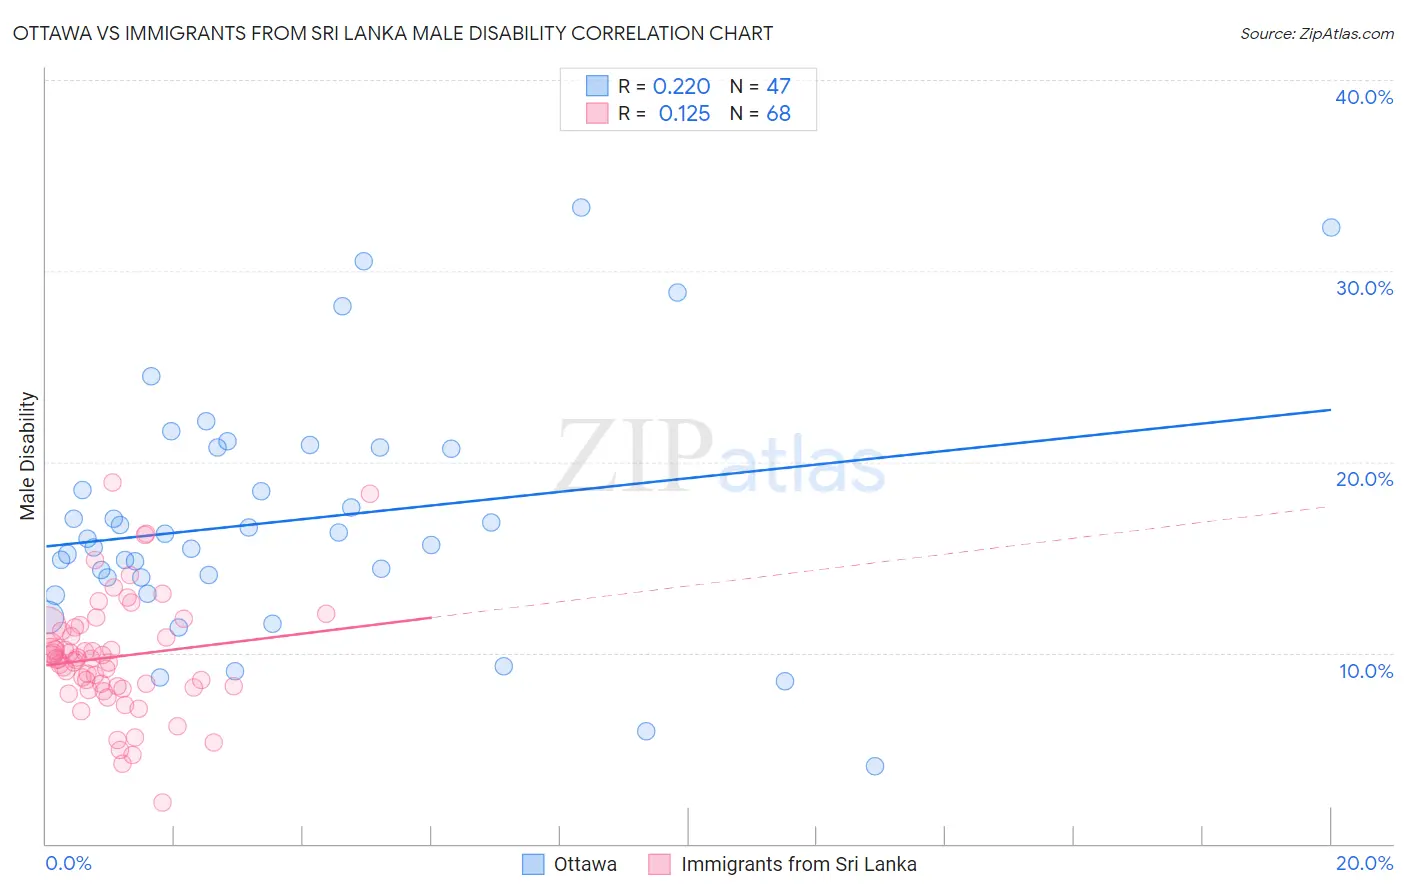
Ottawa vs Immigrants from Sri Lanka Male Disability Correlation Chart
The statistical analysis conducted on geographies consisting of 49,955,365 people shows a weak positive correlation between the proportion of Ottawa and percentage of males with a disability in the United States with a correlation coefficient (R) of 0.220 and weighted average of 14.1%. Similarly, the statistical analysis conducted on geographies consisting of 149,698,030 people shows a poor positive correlation between the proportion of Immigrants from Sri Lanka and percentage of males with a disability in the United States with a correlation coefficient (R) of 0.125 and weighted average of 10.0%, a difference of 41.3%.
Male Disability Correlation Summary
| Measurement | Ottawa | Immigrants from Sri Lanka |
| Minimum | 4.1% | 2.1% |
| Maximum | 33.3% | 18.9% |
| Range | 29.3% | 16.8% |
| Mean | 16.9% | 9.8% |
| Median | 16.0% | 9.7% |
| Interquartile 25% (IQ1) | 13.9% | 8.2% |
| Interquartile 75% (IQ3) | 20.7% | 11.2% |
| Interquartile Range (IQR) | 6.8% | 3.0% |
| Standard Deviation (Sample) | 6.4% | 3.1% |
| Standard Deviation (Population) | 6.3% | 3.0% |
Similar Demographics by Male Disability
Demographics Similar to Ottawa by Male Disability
In terms of male disability, the demographic groups most similar to Ottawa are Comanche (14.1%, a difference of 0.11%), Osage (14.0%, a difference of 0.44%), Apache (14.0%, a difference of 0.51%), Native/Alaskan (14.2%, a difference of 0.94%), and Potawatomi (14.2%, a difference of 1.1%).
| Demographics | Rating | Rank | Male Disability |
| Cree | 0.0 /100 | #318 | Tragic 13.7% |
| Americans | 0.0 /100 | #319 | Tragic 13.8% |
| Tlingit-Haida | 0.0 /100 | #320 | Tragic 13.8% |
| Shoshone | 0.0 /100 | #321 | Tragic 13.8% |
| Apache | 0.0 /100 | #322 | Tragic 14.0% |
| Osage | 0.0 /100 | #323 | Tragic 14.0% |
| Comanche | 0.0 /100 | #324 | Tragic 14.1% |
| Ottawa | 0.0 /100 | #325 | Tragic 14.1% |
| Natives/Alaskans | 0.0 /100 | #326 | Tragic 14.2% |
| Potawatomi | 0.0 /100 | #327 | Tragic 14.2% |
| Chippewa | 0.0 /100 | #328 | Tragic 14.3% |
| Cajuns | 0.0 /100 | #329 | Tragic 14.4% |
| Navajo | 0.0 /100 | #330 | Tragic 14.4% |
| Tohono O'odham | 0.0 /100 | #331 | Tragic 14.6% |
| Seminole | 0.0 /100 | #332 | Tragic 14.7% |
Demographics Similar to Immigrants from Sri Lanka by Male Disability
In terms of male disability, the demographic groups most similar to Immigrants from Sri Lanka are Asian (10.0%, a difference of 0.060%), Burmese (10.0%, a difference of 0.16%), Immigrants from Venezuela (10.0%, a difference of 0.45%), Cypriot (10.0%, a difference of 0.54%), and Immigrants from Asia (10.0%, a difference of 0.68%).
| Demographics | Rating | Rank | Male Disability |
| Bolivians | 100.0 /100 | #12 | Exceptional 9.6% |
| Iranians | 100.0 /100 | #13 | Exceptional 9.7% |
| Immigrants | Iran | 100.0 /100 | #14 | Exceptional 9.7% |
| Indians (Asian) | 100.0 /100 | #15 | Exceptional 9.7% |
| Okinawans | 100.0 /100 | #16 | Exceptional 9.8% |
| Immigrants | Korea | 100.0 /100 | #17 | Exceptional 9.8% |
| Immigrants | Pakistan | 100.0 /100 | #18 | Exceptional 9.8% |
| Immigrants | Sri Lanka | 100.0 /100 | #19 | Exceptional 10.0% |
| Asians | 100.0 /100 | #20 | Exceptional 10.0% |
| Burmese | 100.0 /100 | #21 | Exceptional 10.0% |
| Immigrants | Venezuela | 100.0 /100 | #22 | Exceptional 10.0% |
| Cypriots | 100.0 /100 | #23 | Exceptional 10.0% |
| Immigrants | Asia | 100.0 /100 | #24 | Exceptional 10.0% |
| Immigrants | Malaysia | 99.9 /100 | #25 | Exceptional 10.0% |
| Paraguayans | 99.9 /100 | #26 | Exceptional 10.1% |