Ottawa vs Immigrants from Czechoslovakia Divorced or Separated
COMPARE
Ottawa
Immigrants from Czechoslovakia
Divorced or Separated
Divorced or Separated Comparison
Ottawa
Immigrants from Czechoslovakia
13.2%
DIVORCED OR SEPARATED
0.0/ 100
METRIC RATING
308th/ 347
METRIC RANK
11.7%
DIVORCED OR SEPARATED
96.9/ 100
METRIC RATING
110th/ 347
METRIC RANK
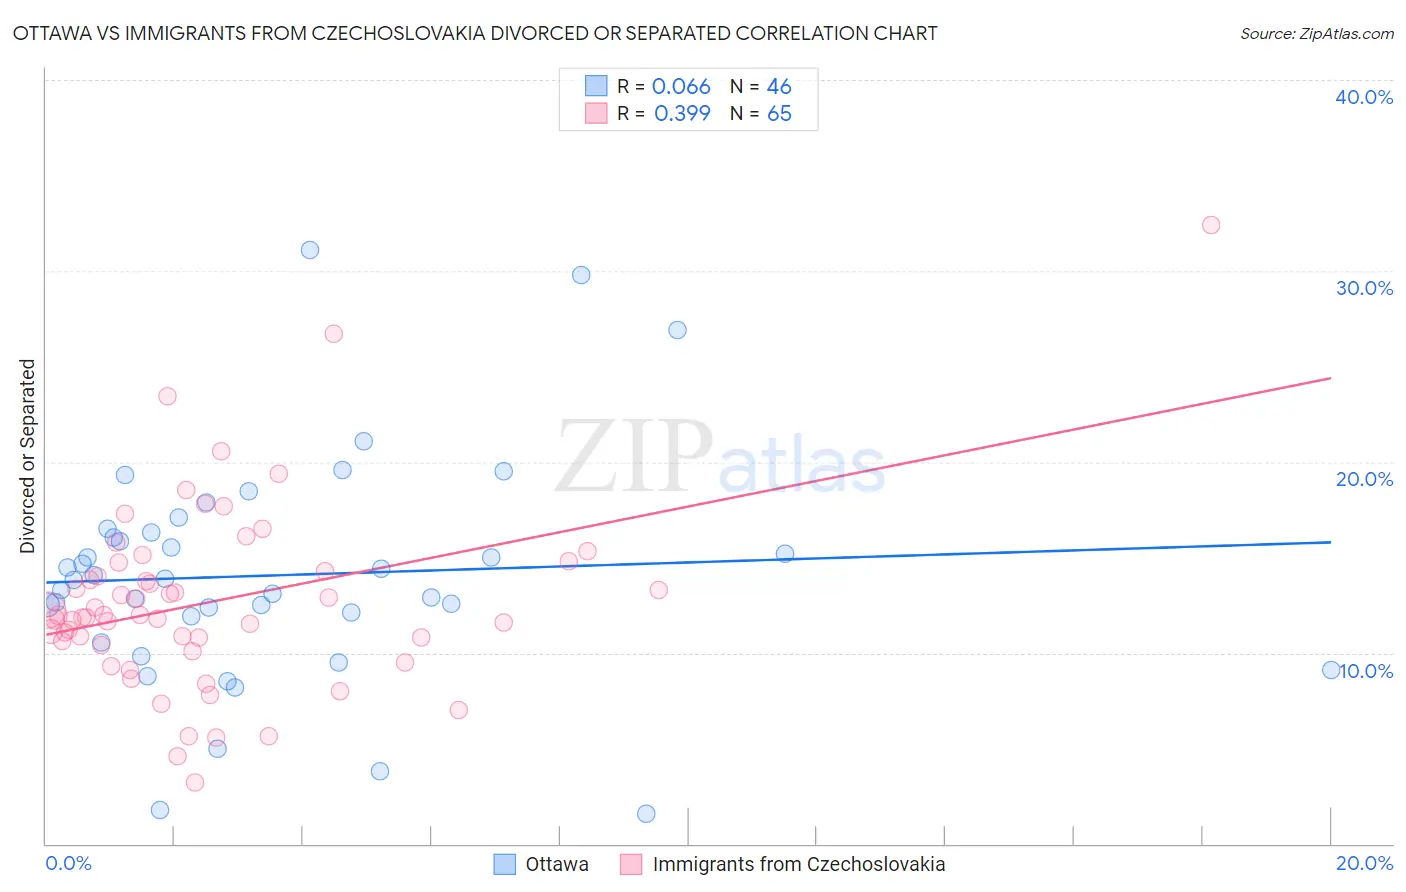
Ottawa vs Immigrants from Czechoslovakia Divorced or Separated Correlation Chart
The statistical analysis conducted on geographies consisting of 49,956,568 people shows a slight positive correlation between the proportion of Ottawa and percentage of population currently divorced or separated in the United States with a correlation coefficient (R) of 0.066 and weighted average of 13.2%. Similarly, the statistical analysis conducted on geographies consisting of 195,447,895 people shows a mild positive correlation between the proportion of Immigrants from Czechoslovakia and percentage of population currently divorced or separated in the United States with a correlation coefficient (R) of 0.399 and weighted average of 11.7%, a difference of 13.1%.
Divorced or Separated Correlation Summary
| Measurement | Ottawa | Immigrants from Czechoslovakia |
| Minimum | 1.6% | 3.2% |
| Maximum | 31.1% | 32.4% |
| Range | 29.5% | 29.2% |
| Mean | 14.1% | 12.7% |
| Median | 13.8% | 12.0% |
| Interquartile 25% (IQ1) | 11.9% | 10.5% |
| Interquartile 75% (IQ3) | 16.3% | 14.5% |
| Interquartile Range (IQR) | 4.4% | 4.0% |
| Standard Deviation (Sample) | 6.0% | 4.9% |
| Standard Deviation (Population) | 5.9% | 4.8% |
Similar Demographics by Divorced or Separated
Demographics Similar to Ottawa by Divorced or Separated
In terms of divorced or separated, the demographic groups most similar to Ottawa are American (13.2%, a difference of 0.010%), African (13.2%, a difference of 0.030%), Sioux (13.2%, a difference of 0.050%), French American Indian (13.2%, a difference of 0.090%), and Tlingit-Haida (13.2%, a difference of 0.34%).
| Demographics | Rating | Rank | Divorced or Separated |
| Alaskan Athabascans | 0.0 /100 | #301 | Tragic 13.1% |
| Immigrants | Venezuela | 0.0 /100 | #302 | Tragic 13.1% |
| Cape Verdeans | 0.0 /100 | #303 | Tragic 13.1% |
| Hopi | 0.0 /100 | #304 | Tragic 13.2% |
| Chippewa | 0.0 /100 | #305 | Tragic 13.2% |
| Tlingit-Haida | 0.0 /100 | #306 | Tragic 13.2% |
| French American Indians | 0.0 /100 | #307 | Tragic 13.2% |
| Ottawa | 0.0 /100 | #308 | Tragic 13.2% |
| Americans | 0.0 /100 | #309 | Tragic 13.2% |
| Africans | 0.0 /100 | #310 | Tragic 13.2% |
| Sioux | 0.0 /100 | #311 | Tragic 13.2% |
| Blackfeet | 0.0 /100 | #312 | Tragic 13.3% |
| Immigrants | Nicaragua | 0.0 /100 | #313 | Tragic 13.3% |
| Yaqui | 0.0 /100 | #314 | Tragic 13.3% |
| Spanish Americans | 0.0 /100 | #315 | Tragic 13.3% |
Demographics Similar to Immigrants from Czechoslovakia by Divorced or Separated
In terms of divorced or separated, the demographic groups most similar to Immigrants from Czechoslovakia are Immigrants from South Africa (11.7%, a difference of 0.0%), Greek (11.7%, a difference of 0.010%), Immigrants from Spain (11.7%, a difference of 0.040%), Immigrants from France (11.7%, a difference of 0.090%), and Estonian (11.7%, a difference of 0.090%).
| Demographics | Rating | Rank | Divorced or Separated |
| Maltese | 98.2 /100 | #103 | Exceptional 11.6% |
| Salvadorans | 98.2 /100 | #104 | Exceptional 11.6% |
| Immigrants | El Salvador | 97.9 /100 | #105 | Exceptional 11.7% |
| Immigrants | Kazakhstan | 97.8 /100 | #106 | Exceptional 11.7% |
| Native Hawaiians | 97.2 /100 | #107 | Exceptional 11.7% |
| Greeks | 96.9 /100 | #108 | Exceptional 11.7% |
| Immigrants | South Africa | 96.9 /100 | #109 | Exceptional 11.7% |
| Immigrants | Czechoslovakia | 96.9 /100 | #110 | Exceptional 11.7% |
| Immigrants | Spain | 96.8 /100 | #111 | Exceptional 11.7% |
| Immigrants | France | 96.6 /100 | #112 | Exceptional 11.7% |
| Estonians | 96.6 /100 | #113 | Exceptional 11.7% |
| Immigrants | Norway | 95.9 /100 | #114 | Exceptional 11.7% |
| Lithuanians | 95.7 /100 | #115 | Exceptional 11.7% |
| Immigrants | Iraq | 95.4 /100 | #116 | Exceptional 11.7% |
| Immigrants | Uganda | 95.3 /100 | #117 | Exceptional 11.7% |