Ottawa vs Hispanic or Latino Hearing Disability
COMPARE
Ottawa
Hispanic or Latino
Hearing Disability
Hearing Disability Comparison
Ottawa
Hispanics or Latinos
3.8%
HEARING DISABILITY
0.0/ 100
METRIC RATING
308th/ 347
METRIC RANK
3.1%
HEARING DISABILITY
15.1/ 100
METRIC RATING
207th/ 347
METRIC RANK
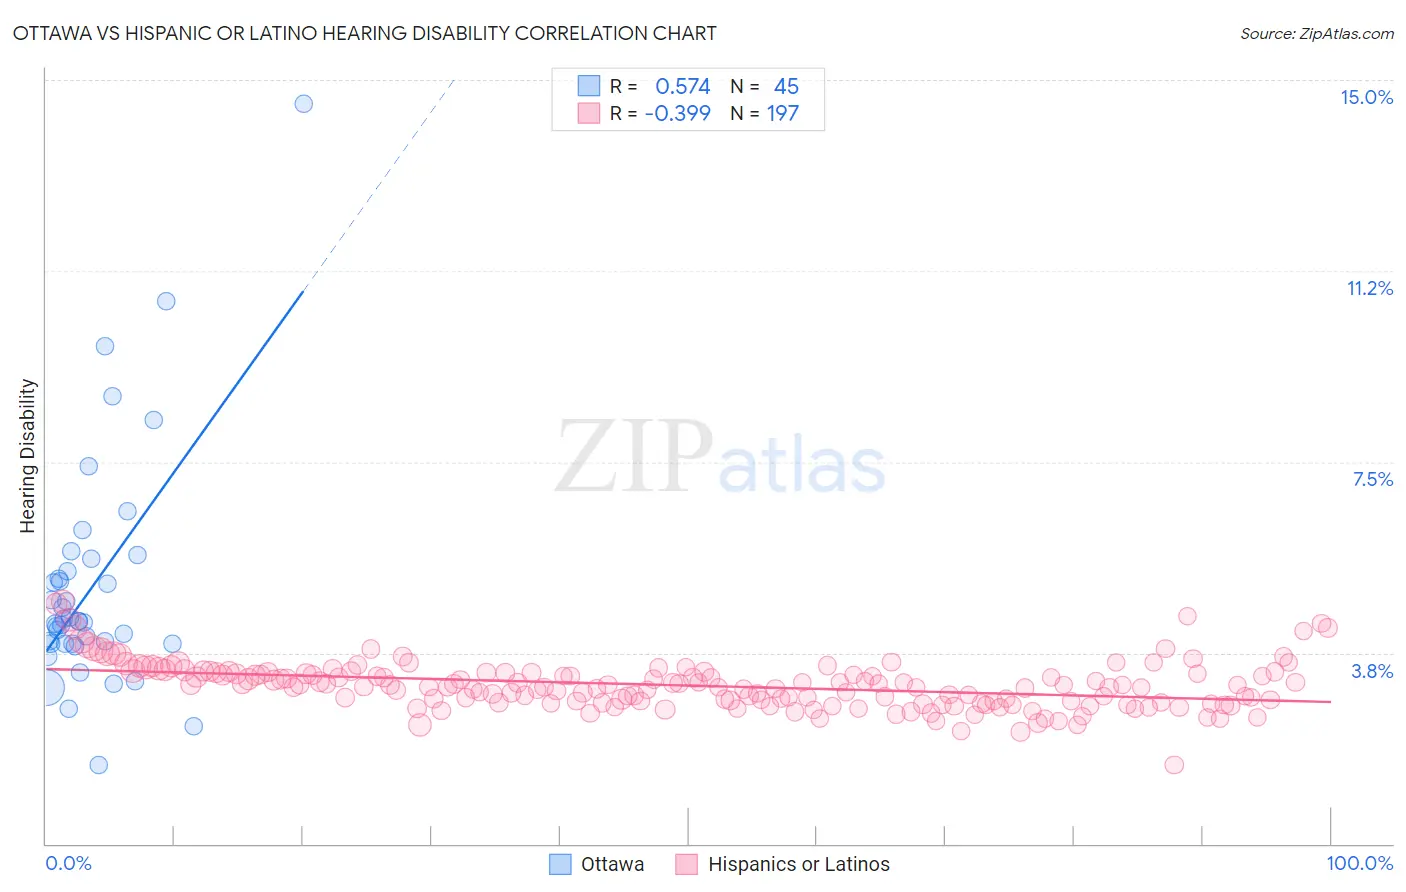
Ottawa vs Hispanic or Latino Hearing Disability Correlation Chart
The statistical analysis conducted on geographies consisting of 49,954,847 people shows a substantial positive correlation between the proportion of Ottawa and percentage of population with hearing disability in the United States with a correlation coefficient (R) of 0.574 and weighted average of 3.8%. Similarly, the statistical analysis conducted on geographies consisting of 570,237,836 people shows a mild negative correlation between the proportion of Hispanics or Latinos and percentage of population with hearing disability in the United States with a correlation coefficient (R) of -0.399 and weighted average of 3.1%, a difference of 22.9%.
Hearing Disability Correlation Summary
| Measurement | Ottawa | Hispanic or Latino |
| Minimum | 1.5% | 1.5% |
| Maximum | 14.5% | 4.8% |
| Range | 13.0% | 3.2% |
| Mean | 5.0% | 3.1% |
| Median | 4.4% | 3.1% |
| Interquartile 25% (IQ1) | 3.9% | 2.8% |
| Interquartile 75% (IQ3) | 5.5% | 3.4% |
| Interquartile Range (IQR) | 1.5% | 0.57% |
| Standard Deviation (Sample) | 2.3% | 0.46% |
| Standard Deviation (Population) | 2.3% | 0.46% |
Similar Demographics by Hearing Disability
Demographics Similar to Ottawa by Hearing Disability
In terms of hearing disability, the demographic groups most similar to Ottawa are Scotch-Irish (3.8%, a difference of 0.080%), Cree (3.8%, a difference of 0.39%), French Canadian (3.8%, a difference of 0.44%), Marshallese (3.8%, a difference of 0.56%), and English (3.8%, a difference of 1.4%).
| Demographics | Rating | Rank | Hearing Disability |
| Pennsylvania Germans | 0.0 /100 | #301 | Tragic 3.7% |
| Dutch | 0.0 /100 | #302 | Tragic 3.7% |
| Menominee | 0.0 /100 | #303 | Tragic 3.7% |
| French | 0.0 /100 | #304 | Tragic 3.8% |
| English | 0.0 /100 | #305 | Tragic 3.8% |
| Marshallese | 0.0 /100 | #306 | Tragic 3.8% |
| French Canadians | 0.0 /100 | #307 | Tragic 3.8% |
| Ottawa | 0.0 /100 | #308 | Tragic 3.8% |
| Scotch-Irish | 0.0 /100 | #309 | Tragic 3.8% |
| Cree | 0.0 /100 | #310 | Tragic 3.8% |
| Americans | 0.0 /100 | #311 | Tragic 3.9% |
| Cajuns | 0.0 /100 | #312 | Tragic 3.9% |
| Hopi | 0.0 /100 | #313 | Tragic 3.9% |
| Yakama | 0.0 /100 | #314 | Tragic 3.9% |
| Puget Sound Salish | 0.0 /100 | #315 | Tragic 3.9% |
Demographics Similar to Hispanics or Latinos by Hearing Disability
In terms of hearing disability, the demographic groups most similar to Hispanics or Latinos are Eastern European (3.1%, a difference of 0.070%), Immigrants from Czechoslovakia (3.1%, a difference of 0.13%), Alsatian (3.1%, a difference of 0.13%), Immigrants from Denmark (3.1%, a difference of 0.18%), and Immigrants from Thailand (3.1%, a difference of 0.22%).
| Demographics | Rating | Rank | Hearing Disability |
| Immigrants | North Macedonia | 19.1 /100 | #200 | Poor 3.1% |
| Iraqis | 19.0 /100 | #201 | Poor 3.1% |
| Immigrants | Thailand | 16.4 /100 | #202 | Poor 3.1% |
| Immigrants | Denmark | 16.2 /100 | #203 | Poor 3.1% |
| Immigrants | Czechoslovakia | 15.9 /100 | #204 | Poor 3.1% |
| Alsatians | 15.9 /100 | #205 | Poor 3.1% |
| Eastern Europeans | 15.5 /100 | #206 | Poor 3.1% |
| Hispanics or Latinos | 15.1 /100 | #207 | Poor 3.1% |
| Immigrants | Latvia | 12.7 /100 | #208 | Poor 3.1% |
| Immigrants | Hungary | 12.5 /100 | #209 | Poor 3.1% |
| Cape Verdeans | 12.2 /100 | #210 | Poor 3.1% |
| Romanians | 12.1 /100 | #211 | Poor 3.1% |
| Pakistanis | 11.1 /100 | #212 | Poor 3.1% |
| Immigrants | Iraq | 10.5 /100 | #213 | Poor 3.1% |
| Australians | 8.1 /100 | #214 | Tragic 3.2% |