Ottawa vs Central American Hearing Disability
COMPARE
Ottawa
Central American
Hearing Disability
Hearing Disability Comparison
Ottawa
Central Americans
3.8%
HEARING DISABILITY
0.0/ 100
METRIC RATING
308th/ 347
METRIC RANK
2.7%
HEARING DISABILITY
97.7/ 100
METRIC RATING
71st/ 347
METRIC RANK
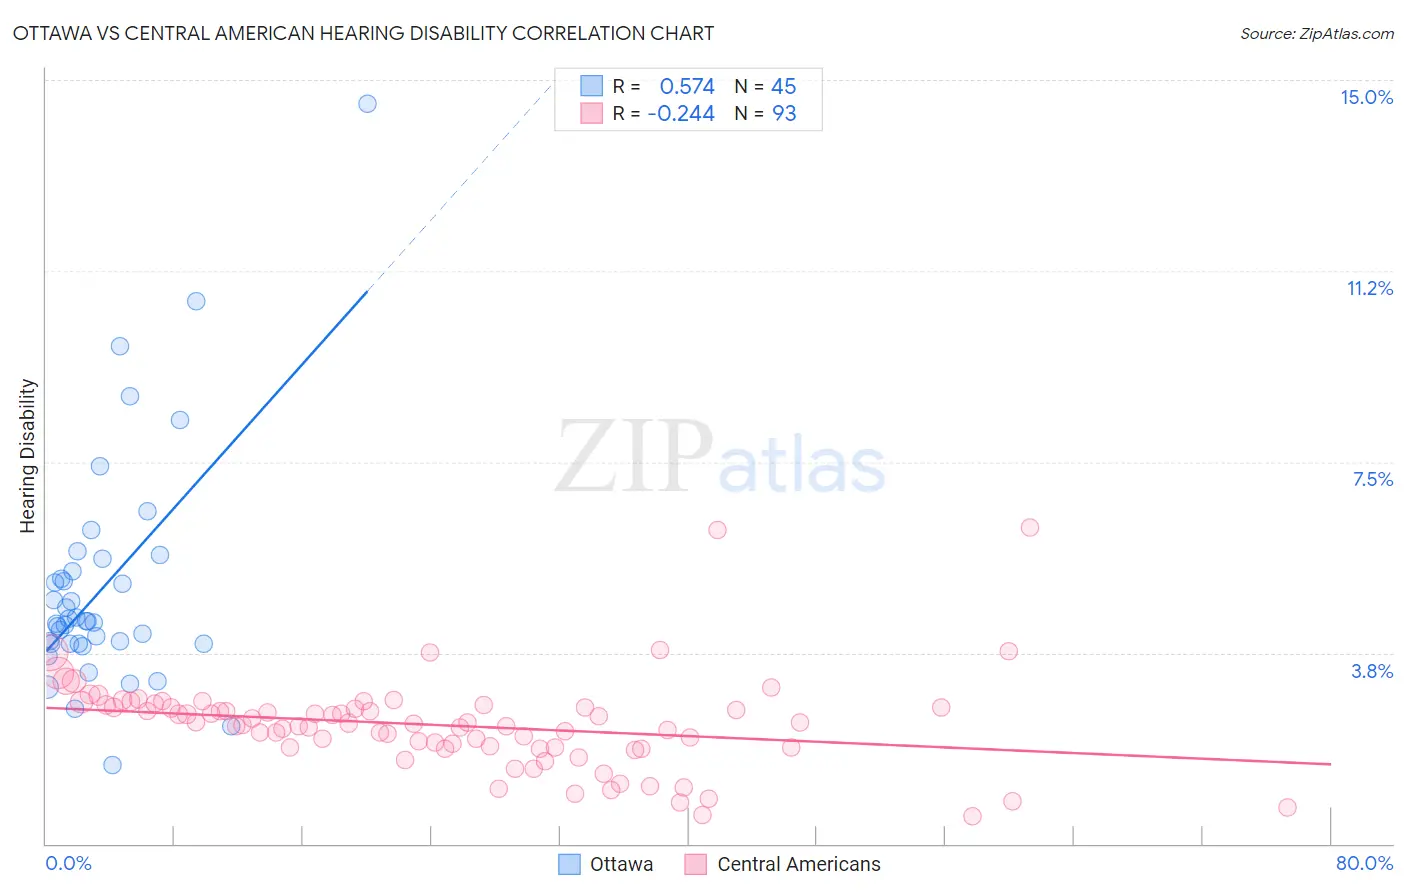
Ottawa vs Central American Hearing Disability Correlation Chart
The statistical analysis conducted on geographies consisting of 49,954,847 people shows a substantial positive correlation between the proportion of Ottawa and percentage of population with hearing disability in the United States with a correlation coefficient (R) of 0.574 and weighted average of 3.8%. Similarly, the statistical analysis conducted on geographies consisting of 504,204,845 people shows a weak negative correlation between the proportion of Central Americans and percentage of population with hearing disability in the United States with a correlation coefficient (R) of -0.244 and weighted average of 2.7%, a difference of 40.2%.
Hearing Disability Correlation Summary
| Measurement | Ottawa | Central American |
| Minimum | 1.5% | 0.55% |
| Maximum | 14.5% | 6.2% |
| Range | 13.0% | 5.7% |
| Mean | 5.0% | 2.3% |
| Median | 4.4% | 2.4% |
| Interquartile 25% (IQ1) | 3.9% | 1.9% |
| Interquartile 75% (IQ3) | 5.5% | 2.7% |
| Interquartile Range (IQR) | 1.5% | 0.81% |
| Standard Deviation (Sample) | 2.3% | 0.91% |
| Standard Deviation (Population) | 2.3% | 0.91% |
Similar Demographics by Hearing Disability
Demographics Similar to Ottawa by Hearing Disability
In terms of hearing disability, the demographic groups most similar to Ottawa are Scotch-Irish (3.8%, a difference of 0.080%), Cree (3.8%, a difference of 0.39%), French Canadian (3.8%, a difference of 0.44%), Marshallese (3.8%, a difference of 0.56%), and English (3.8%, a difference of 1.4%).
| Demographics | Rating | Rank | Hearing Disability |
| Pennsylvania Germans | 0.0 /100 | #301 | Tragic 3.7% |
| Dutch | 0.0 /100 | #302 | Tragic 3.7% |
| Menominee | 0.0 /100 | #303 | Tragic 3.7% |
| French | 0.0 /100 | #304 | Tragic 3.8% |
| English | 0.0 /100 | #305 | Tragic 3.8% |
| Marshallese | 0.0 /100 | #306 | Tragic 3.8% |
| French Canadians | 0.0 /100 | #307 | Tragic 3.8% |
| Ottawa | 0.0 /100 | #308 | Tragic 3.8% |
| Scotch-Irish | 0.0 /100 | #309 | Tragic 3.8% |
| Cree | 0.0 /100 | #310 | Tragic 3.8% |
| Americans | 0.0 /100 | #311 | Tragic 3.9% |
| Cajuns | 0.0 /100 | #312 | Tragic 3.9% |
| Hopi | 0.0 /100 | #313 | Tragic 3.9% |
| Yakama | 0.0 /100 | #314 | Tragic 3.9% |
| Puget Sound Salish | 0.0 /100 | #315 | Tragic 3.9% |
Demographics Similar to Central Americans by Hearing Disability
In terms of hearing disability, the demographic groups most similar to Central Americans are Peruvian (2.7%, a difference of 0.050%), Afghan (2.7%, a difference of 0.10%), Argentinean (2.7%, a difference of 0.18%), Immigrants from Korea (2.7%, a difference of 0.18%), and Immigrants from Saudi Arabia (2.7%, a difference of 0.21%).
| Demographics | Rating | Rank | Hearing Disability |
| Immigrants | Sri Lanka | 98.4 /100 | #64 | Exceptional 2.7% |
| Immigrants | Nepal | 98.3 /100 | #65 | Exceptional 2.7% |
| Immigrants | Belize | 98.2 /100 | #66 | Exceptional 2.7% |
| Egyptians | 98.1 /100 | #67 | Exceptional 2.7% |
| Immigrants | Africa | 98.0 /100 | #68 | Exceptional 2.7% |
| Nicaraguans | 97.9 /100 | #69 | Exceptional 2.7% |
| Peruvians | 97.7 /100 | #70 | Exceptional 2.7% |
| Central Americans | 97.7 /100 | #71 | Exceptional 2.7% |
| Afghans | 97.6 /100 | #72 | Exceptional 2.7% |
| Argentineans | 97.5 /100 | #73 | Exceptional 2.7% |
| Immigrants | Korea | 97.5 /100 | #74 | Exceptional 2.7% |
| Immigrants | Saudi Arabia | 97.5 /100 | #75 | Exceptional 2.7% |
| Asians | 97.5 /100 | #76 | Exceptional 2.7% |
| Immigrants | Malaysia | 97.5 /100 | #77 | Exceptional 2.7% |
| Mongolians | 97.4 /100 | #78 | Exceptional 2.7% |