Ottawa vs Alaskan Athabascan Hearing Disability
COMPARE
Ottawa
Alaskan Athabascan
Hearing Disability
Hearing Disability Comparison
Ottawa
Alaskan Athabascans
3.8%
HEARING DISABILITY
0.0/ 100
METRIC RATING
308th/ 347
METRIC RANK
5.3%
HEARING DISABILITY
0.0/ 100
METRIC RATING
345th/ 347
METRIC RANK
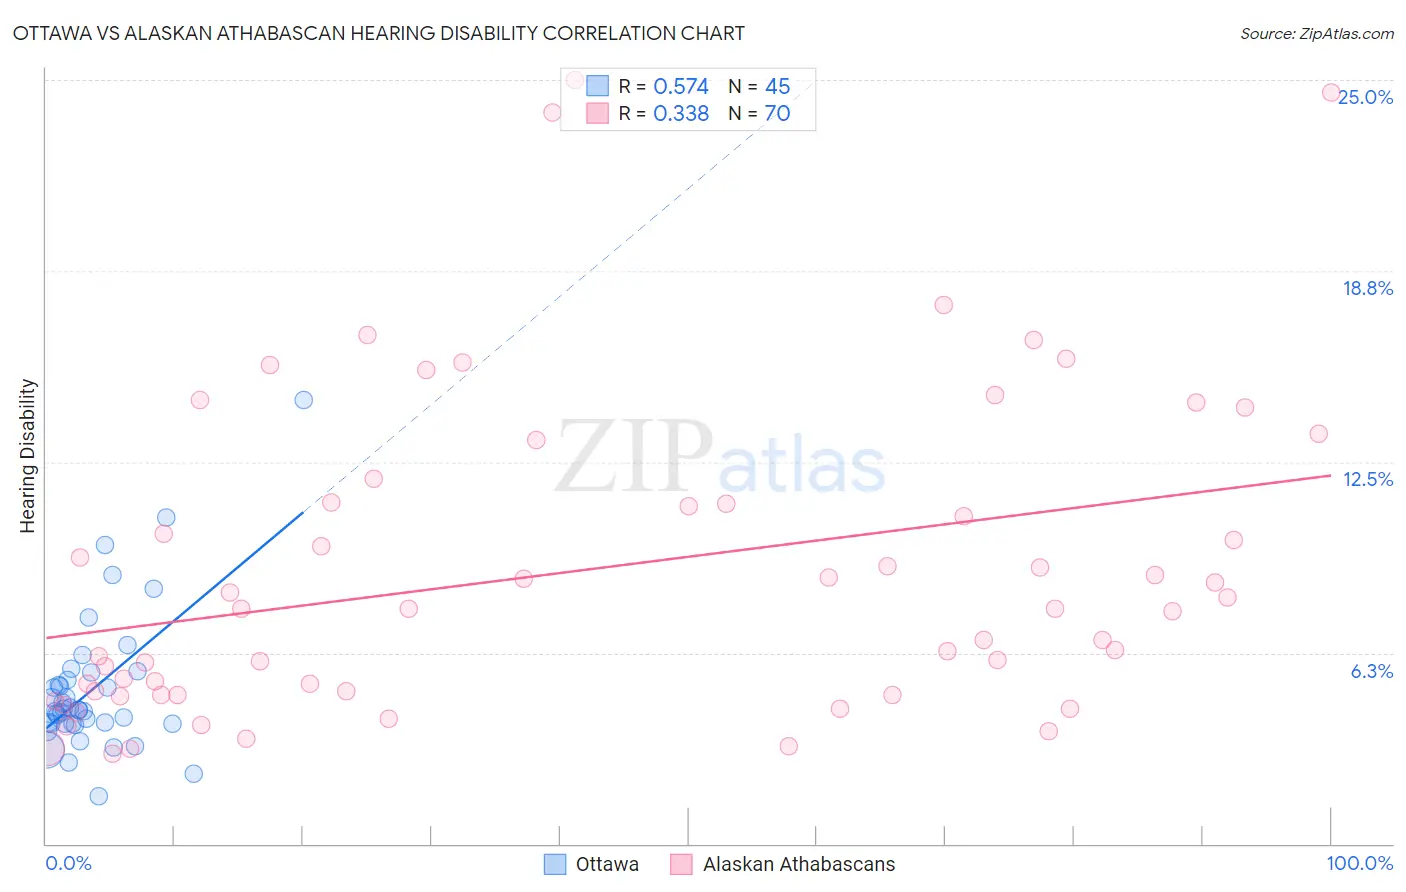
Ottawa vs Alaskan Athabascan Hearing Disability Correlation Chart
The statistical analysis conducted on geographies consisting of 49,954,847 people shows a substantial positive correlation between the proportion of Ottawa and percentage of population with hearing disability in the United States with a correlation coefficient (R) of 0.574 and weighted average of 3.8%. Similarly, the statistical analysis conducted on geographies consisting of 45,819,269 people shows a mild positive correlation between the proportion of Alaskan Athabascans and percentage of population with hearing disability in the United States with a correlation coefficient (R) of 0.338 and weighted average of 5.3%, a difference of 39.1%.
Hearing Disability Correlation Summary
| Measurement | Ottawa | Alaskan Athabascan |
| Minimum | 1.5% | 2.9% |
| Maximum | 14.5% | 25.0% |
| Range | 13.0% | 22.1% |
| Mean | 5.0% | 9.0% |
| Median | 4.4% | 7.7% |
| Interquartile 25% (IQ1) | 3.9% | 4.9% |
| Interquartile 75% (IQ3) | 5.5% | 11.2% |
| Interquartile Range (IQR) | 1.5% | 6.3% |
| Standard Deviation (Sample) | 2.3% | 5.2% |
| Standard Deviation (Population) | 2.3% | 5.2% |
Similar Demographics by Hearing Disability
Demographics Similar to Ottawa by Hearing Disability
In terms of hearing disability, the demographic groups most similar to Ottawa are Scotch-Irish (3.8%, a difference of 0.080%), Cree (3.8%, a difference of 0.39%), French Canadian (3.8%, a difference of 0.44%), Marshallese (3.8%, a difference of 0.56%), and English (3.8%, a difference of 1.4%).
| Demographics | Rating | Rank | Hearing Disability |
| Pennsylvania Germans | 0.0 /100 | #301 | Tragic 3.7% |
| Dutch | 0.0 /100 | #302 | Tragic 3.7% |
| Menominee | 0.0 /100 | #303 | Tragic 3.7% |
| French | 0.0 /100 | #304 | Tragic 3.8% |
| English | 0.0 /100 | #305 | Tragic 3.8% |
| Marshallese | 0.0 /100 | #306 | Tragic 3.8% |
| French Canadians | 0.0 /100 | #307 | Tragic 3.8% |
| Ottawa | 0.0 /100 | #308 | Tragic 3.8% |
| Scotch-Irish | 0.0 /100 | #309 | Tragic 3.8% |
| Cree | 0.0 /100 | #310 | Tragic 3.8% |
| Americans | 0.0 /100 | #311 | Tragic 3.9% |
| Cajuns | 0.0 /100 | #312 | Tragic 3.9% |
| Hopi | 0.0 /100 | #313 | Tragic 3.9% |
| Yakama | 0.0 /100 | #314 | Tragic 3.9% |
| Puget Sound Salish | 0.0 /100 | #315 | Tragic 3.9% |
Demographics Similar to Alaskan Athabascans by Hearing Disability
In terms of hearing disability, the demographic groups most similar to Alaskan Athabascans are Colville (5.3%, a difference of 0.43%), Yup'ik (5.8%, a difference of 9.7%), Tlingit-Haida (4.8%, a difference of 9.9%), Inupiat (4.7%, a difference of 12.9%), and Tsimshian (4.7%, a difference of 13.2%).
| Demographics | Rating | Rank | Hearing Disability |
| Dutch West Indians | 0.0 /100 | #333 | Tragic 4.3% |
| Aleuts | 0.0 /100 | #334 | Tragic 4.3% |
| Kiowa | 0.0 /100 | #335 | Tragic 4.3% |
| Creek | 0.0 /100 | #336 | Tragic 4.4% |
| Chickasaw | 0.0 /100 | #337 | Tragic 4.5% |
| Alaska Natives | 0.0 /100 | #338 | Tragic 4.5% |
| Choctaw | 0.0 /100 | #339 | Tragic 4.5% |
| Pueblo | 0.0 /100 | #340 | Tragic 4.6% |
| Navajo | 0.0 /100 | #341 | Tragic 4.6% |
| Tsimshian | 0.0 /100 | #342 | Tragic 4.7% |
| Inupiat | 0.0 /100 | #343 | Tragic 4.7% |
| Tlingit-Haida | 0.0 /100 | #344 | Tragic 4.8% |
| Alaskan Athabascans | 0.0 /100 | #345 | Tragic 5.3% |
| Colville | 0.0 /100 | #346 | Tragic 5.3% |
| Yup'ik | 0.0 /100 | #347 | Tragic 5.8% |