Ottawa vs British West Indian Hearing Disability
COMPARE
Ottawa
British West Indian
Hearing Disability
Hearing Disability Comparison
Ottawa
British West Indians
3.8%
HEARING DISABILITY
0.0/ 100
METRIC RATING
308th/ 347
METRIC RANK
2.4%
HEARING DISABILITY
100.0/ 100
METRIC RATING
8th/ 347
METRIC RANK
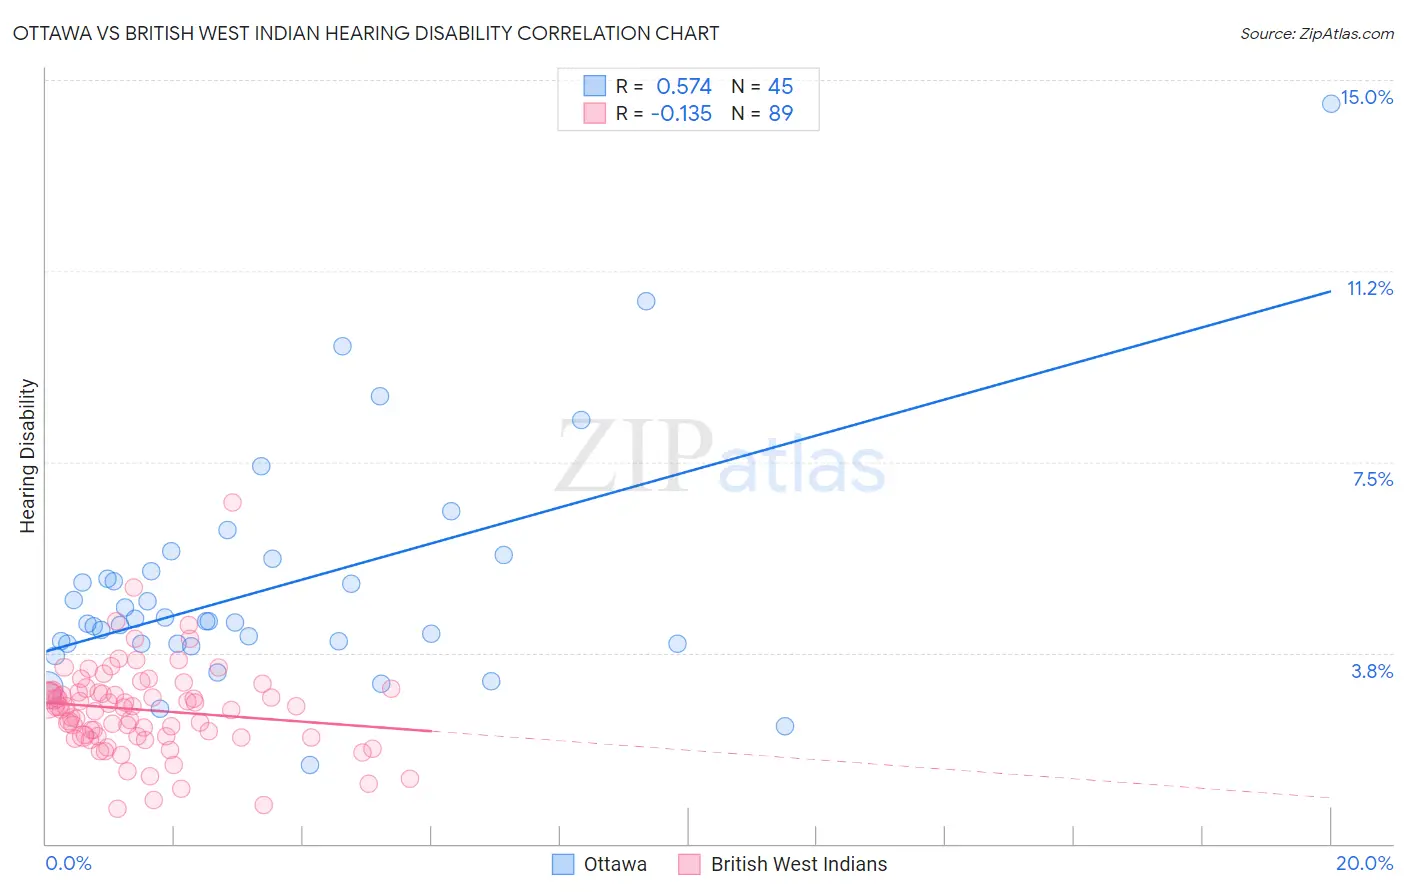
Ottawa vs British West Indian Hearing Disability Correlation Chart
The statistical analysis conducted on geographies consisting of 49,954,847 people shows a substantial positive correlation between the proportion of Ottawa and percentage of population with hearing disability in the United States with a correlation coefficient (R) of 0.574 and weighted average of 3.8%. Similarly, the statistical analysis conducted on geographies consisting of 152,668,246 people shows a poor negative correlation between the proportion of British West Indians and percentage of population with hearing disability in the United States with a correlation coefficient (R) of -0.135 and weighted average of 2.4%, a difference of 57.5%.
Hearing Disability Correlation Summary
| Measurement | Ottawa | British West Indian |
| Minimum | 1.5% | 0.70% |
| Maximum | 14.5% | 6.7% |
| Range | 13.0% | 6.0% |
| Mean | 5.0% | 2.6% |
| Median | 4.4% | 2.7% |
| Interquartile 25% (IQ1) | 3.9% | 2.1% |
| Interquartile 75% (IQ3) | 5.5% | 3.0% |
| Interquartile Range (IQR) | 1.5% | 0.87% |
| Standard Deviation (Sample) | 2.3% | 0.90% |
| Standard Deviation (Population) | 2.3% | 0.89% |
Similar Demographics by Hearing Disability
Demographics Similar to Ottawa by Hearing Disability
In terms of hearing disability, the demographic groups most similar to Ottawa are Scotch-Irish (3.8%, a difference of 0.080%), Cree (3.8%, a difference of 0.39%), French Canadian (3.8%, a difference of 0.44%), Marshallese (3.8%, a difference of 0.56%), and English (3.8%, a difference of 1.4%).
| Demographics | Rating | Rank | Hearing Disability |
| Pennsylvania Germans | 0.0 /100 | #301 | Tragic 3.7% |
| Dutch | 0.0 /100 | #302 | Tragic 3.7% |
| Menominee | 0.0 /100 | #303 | Tragic 3.7% |
| French | 0.0 /100 | #304 | Tragic 3.8% |
| English | 0.0 /100 | #305 | Tragic 3.8% |
| Marshallese | 0.0 /100 | #306 | Tragic 3.8% |
| French Canadians | 0.0 /100 | #307 | Tragic 3.8% |
| Ottawa | 0.0 /100 | #308 | Tragic 3.8% |
| Scotch-Irish | 0.0 /100 | #309 | Tragic 3.8% |
| Cree | 0.0 /100 | #310 | Tragic 3.8% |
| Americans | 0.0 /100 | #311 | Tragic 3.9% |
| Cajuns | 0.0 /100 | #312 | Tragic 3.9% |
| Hopi | 0.0 /100 | #313 | Tragic 3.9% |
| Yakama | 0.0 /100 | #314 | Tragic 3.9% |
| Puget Sound Salish | 0.0 /100 | #315 | Tragic 3.9% |
Demographics Similar to British West Indians by Hearing Disability
In terms of hearing disability, the demographic groups most similar to British West Indians are Immigrants from Bangladesh (2.4%, a difference of 0.22%), Immigrants from Dominican Republic (2.4%, a difference of 0.78%), Vietnamese (2.4%, a difference of 1.8%), Immigrants from Ecuador (2.5%, a difference of 1.8%), and Immigrants from Trinidad and Tobago (2.5%, a difference of 2.4%).
| Demographics | Rating | Rank | Hearing Disability |
| Immigrants | Grenada | 100.0 /100 | #1 | Exceptional 2.2% |
| Immigrants | St. Vincent and the Grenadines | 100.0 /100 | #2 | Exceptional 2.3% |
| Guyanese | 100.0 /100 | #3 | Exceptional 2.3% |
| Immigrants | Guyana | 100.0 /100 | #4 | Exceptional 2.3% |
| Immigrants | Barbados | 100.0 /100 | #5 | Exceptional 2.4% |
| Vietnamese | 100.0 /100 | #6 | Exceptional 2.4% |
| Immigrants | Bangladesh | 100.0 /100 | #7 | Exceptional 2.4% |
| British West Indians | 100.0 /100 | #8 | Exceptional 2.4% |
| Immigrants | Dominican Republic | 100.0 /100 | #9 | Exceptional 2.4% |
| Immigrants | Ecuador | 99.9 /100 | #10 | Exceptional 2.5% |
| Immigrants | Trinidad and Tobago | 99.9 /100 | #11 | Exceptional 2.5% |
| Trinidadians and Tobagonians | 99.9 /100 | #12 | Exceptional 2.5% |
| Sierra Leoneans | 99.9 /100 | #13 | Exceptional 2.5% |
| Ecuadorians | 99.9 /100 | #14 | Exceptional 2.5% |
| Barbadians | 99.9 /100 | #15 | Exceptional 2.5% |