Spanish vs Hispanic or Latino Hearing Disability
COMPARE
Spanish
Hispanic or Latino
Hearing Disability
Hearing Disability Comparison
Spanish
Hispanics or Latinos
3.7%
HEARING DISABILITY
0.0/ 100
METRIC RATING
287th/ 347
METRIC RANK
3.1%
HEARING DISABILITY
15.1/ 100
METRIC RATING
207th/ 347
METRIC RANK
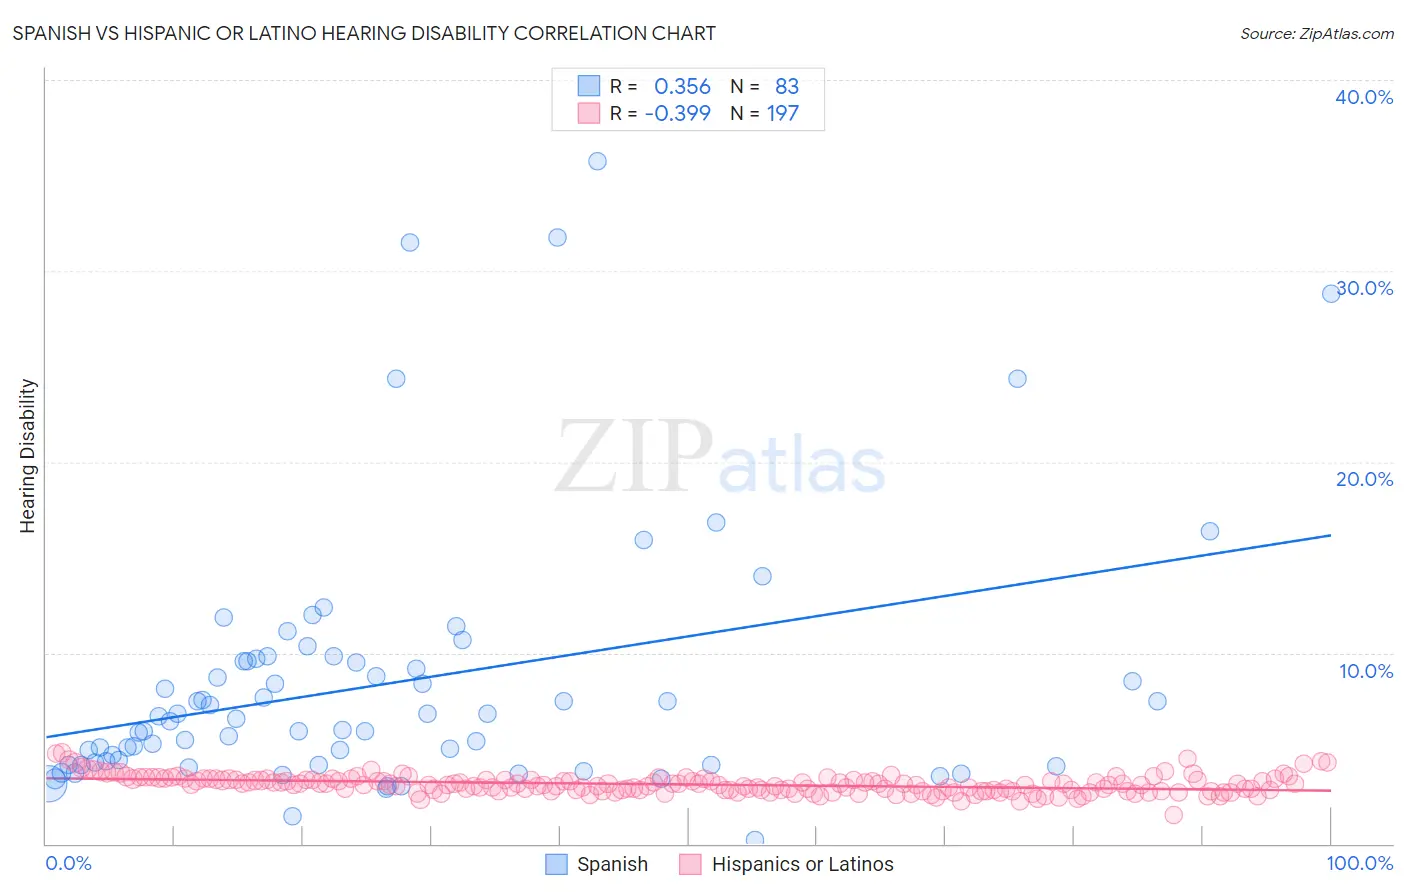
Spanish vs Hispanic or Latino Hearing Disability Correlation Chart
The statistical analysis conducted on geographies consisting of 421,995,316 people shows a mild positive correlation between the proportion of Spanish and percentage of population with hearing disability in the United States with a correlation coefficient (R) of 0.356 and weighted average of 3.7%. Similarly, the statistical analysis conducted on geographies consisting of 570,237,836 people shows a mild negative correlation between the proportion of Hispanics or Latinos and percentage of population with hearing disability in the United States with a correlation coefficient (R) of -0.399 and weighted average of 3.1%, a difference of 17.2%.
Hearing Disability Correlation Summary
| Measurement | Spanish | Hispanic or Latino |
| Minimum | 0.21% | 1.5% |
| Maximum | 35.7% | 4.8% |
| Range | 35.5% | 3.2% |
| Mean | 8.4% | 3.1% |
| Median | 6.5% | 3.1% |
| Interquartile 25% (IQ1) | 4.1% | 2.8% |
| Interquartile 75% (IQ3) | 9.6% | 3.4% |
| Interquartile Range (IQR) | 5.5% | 0.57% |
| Standard Deviation (Sample) | 6.8% | 0.46% |
| Standard Deviation (Population) | 6.8% | 0.46% |
Similar Demographics by Hearing Disability
Demographics Similar to Spanish by Hearing Disability
In terms of hearing disability, the demographic groups most similar to Spanish are Delaware (3.6%, a difference of 0.24%), Sioux (3.6%, a difference of 0.28%), Immigrants from Micronesia (3.6%, a difference of 0.38%), Irish (3.7%, a difference of 0.57%), and Chinese (3.7%, a difference of 0.78%).
| Demographics | Rating | Rank | Hearing Disability |
| French American Indians | 0.0 /100 | #280 | Tragic 3.6% |
| Scandinavians | 0.0 /100 | #281 | Tragic 3.6% |
| Swedes | 0.0 /100 | #282 | Tragic 3.6% |
| Blackfeet | 0.0 /100 | #283 | Tragic 3.6% |
| Immigrants | Micronesia | 0.0 /100 | #284 | Tragic 3.6% |
| Sioux | 0.0 /100 | #285 | Tragic 3.6% |
| Delaware | 0.0 /100 | #286 | Tragic 3.6% |
| Spanish | 0.0 /100 | #287 | Tragic 3.7% |
| Irish | 0.0 /100 | #288 | Tragic 3.7% |
| Chinese | 0.0 /100 | #289 | Tragic 3.7% |
| Whites/Caucasians | 0.0 /100 | #290 | Tragic 3.7% |
| Finns | 0.0 /100 | #291 | Tragic 3.7% |
| Native Hawaiians | 0.0 /100 | #292 | Tragic 3.7% |
| Norwegians | 0.0 /100 | #293 | Tragic 3.7% |
| Iroquois | 0.0 /100 | #294 | Tragic 3.7% |
Demographics Similar to Hispanics or Latinos by Hearing Disability
In terms of hearing disability, the demographic groups most similar to Hispanics or Latinos are Eastern European (3.1%, a difference of 0.070%), Immigrants from Czechoslovakia (3.1%, a difference of 0.13%), Alsatian (3.1%, a difference of 0.13%), Immigrants from Denmark (3.1%, a difference of 0.18%), and Immigrants from Thailand (3.1%, a difference of 0.22%).
| Demographics | Rating | Rank | Hearing Disability |
| Immigrants | North Macedonia | 19.1 /100 | #200 | Poor 3.1% |
| Iraqis | 19.0 /100 | #201 | Poor 3.1% |
| Immigrants | Thailand | 16.4 /100 | #202 | Poor 3.1% |
| Immigrants | Denmark | 16.2 /100 | #203 | Poor 3.1% |
| Immigrants | Czechoslovakia | 15.9 /100 | #204 | Poor 3.1% |
| Alsatians | 15.9 /100 | #205 | Poor 3.1% |
| Eastern Europeans | 15.5 /100 | #206 | Poor 3.1% |
| Hispanics or Latinos | 15.1 /100 | #207 | Poor 3.1% |
| Immigrants | Latvia | 12.7 /100 | #208 | Poor 3.1% |
| Immigrants | Hungary | 12.5 /100 | #209 | Poor 3.1% |
| Cape Verdeans | 12.2 /100 | #210 | Poor 3.1% |
| Romanians | 12.1 /100 | #211 | Poor 3.1% |
| Pakistanis | 11.1 /100 | #212 | Poor 3.1% |
| Immigrants | Iraq | 10.5 /100 | #213 | Poor 3.1% |
| Australians | 8.1 /100 | #214 | Tragic 3.2% |