Immigrants from Moldova vs Hispanic or Latino Hearing Disability
COMPARE
Immigrants from Moldova
Hispanic or Latino
Hearing Disability
Hearing Disability Comparison
Immigrants from Moldova
Hispanics or Latinos
3.0%
HEARING DISABILITY
43.1/ 100
METRIC RATING
179th/ 347
METRIC RANK
3.1%
HEARING DISABILITY
15.1/ 100
METRIC RATING
207th/ 347
METRIC RANK
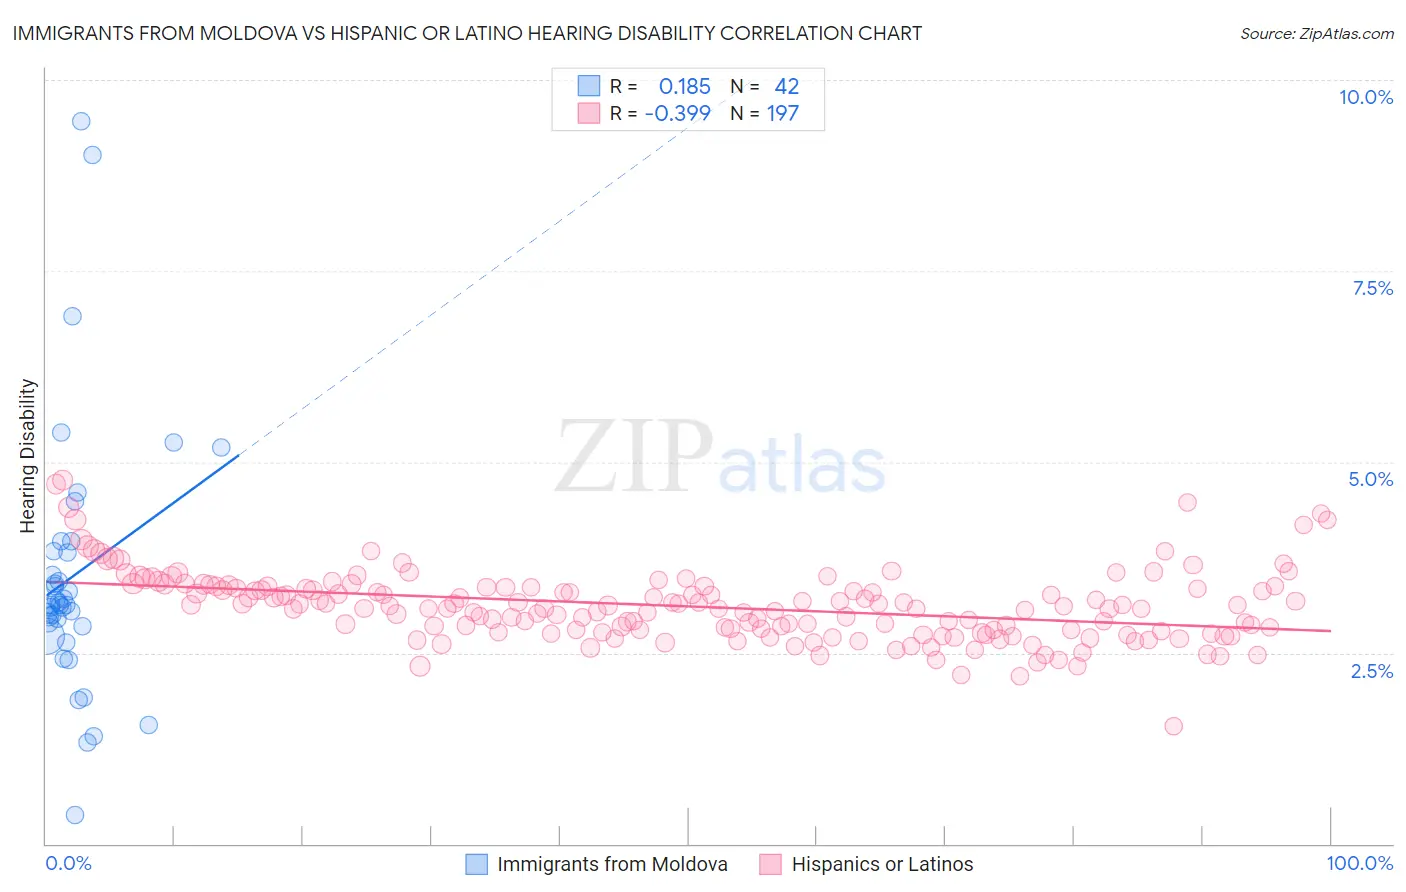
Immigrants from Moldova vs Hispanic or Latino Hearing Disability Correlation Chart
The statistical analysis conducted on geographies consisting of 124,366,720 people shows a poor positive correlation between the proportion of Immigrants from Moldova and percentage of population with hearing disability in the United States with a correlation coefficient (R) of 0.185 and weighted average of 3.0%. Similarly, the statistical analysis conducted on geographies consisting of 570,237,836 people shows a mild negative correlation between the proportion of Hispanics or Latinos and percentage of population with hearing disability in the United States with a correlation coefficient (R) of -0.399 and weighted average of 3.1%, a difference of 3.4%.
Hearing Disability Correlation Summary
| Measurement | Immigrants from Moldova | Hispanic or Latino |
| Minimum | 0.37% | 1.5% |
| Maximum | 9.5% | 4.8% |
| Range | 9.1% | 3.2% |
| Mean | 3.5% | 3.1% |
| Median | 3.1% | 3.1% |
| Interquartile 25% (IQ1) | 2.9% | 2.8% |
| Interquartile 75% (IQ3) | 3.8% | 3.4% |
| Interquartile Range (IQR) | 0.98% | 0.57% |
| Standard Deviation (Sample) | 1.7% | 0.46% |
| Standard Deviation (Population) | 1.7% | 0.46% |
Similar Demographics by Hearing Disability
Demographics Similar to Immigrants from Moldova by Hearing Disability
In terms of hearing disability, the demographic groups most similar to Immigrants from Moldova are Immigrants from Sweden (3.0%, a difference of 0.060%), Immigrants from Belgium (3.0%, a difference of 0.15%), Immigrants from Italy (3.0%, a difference of 0.18%), Japanese (3.0%, a difference of 0.28%), and Immigrants from Philippines (3.0%, a difference of 0.31%).
| Demographics | Rating | Rank | Hearing Disability |
| Armenians | 56.0 /100 | #172 | Average 3.0% |
| Immigrants | Serbia | 51.1 /100 | #173 | Average 3.0% |
| Indonesians | 50.0 /100 | #174 | Average 3.0% |
| Immigrants | Romania | 48.4 /100 | #175 | Average 3.0% |
| Panamanians | 47.0 /100 | #176 | Average 3.0% |
| Immigrants | Philippines | 46.4 /100 | #177 | Average 3.0% |
| Japanese | 46.0 /100 | #178 | Average 3.0% |
| Immigrants | Moldova | 43.1 /100 | #179 | Average 3.0% |
| Immigrants | Sweden | 42.4 /100 | #180 | Average 3.0% |
| Immigrants | Belgium | 41.5 /100 | #181 | Average 3.0% |
| Immigrants | Italy | 41.1 /100 | #182 | Average 3.0% |
| Bulgarians | 39.7 /100 | #183 | Fair 3.0% |
| Immigrants | Ireland | 37.4 /100 | #184 | Fair 3.0% |
| Immigrants | Southern Europe | 35.3 /100 | #185 | Fair 3.0% |
| Immigrants | Mexico | 34.9 /100 | #186 | Fair 3.0% |
Demographics Similar to Hispanics or Latinos by Hearing Disability
In terms of hearing disability, the demographic groups most similar to Hispanics or Latinos are Eastern European (3.1%, a difference of 0.070%), Immigrants from Czechoslovakia (3.1%, a difference of 0.13%), Alsatian (3.1%, a difference of 0.13%), Immigrants from Denmark (3.1%, a difference of 0.18%), and Immigrants from Thailand (3.1%, a difference of 0.22%).
| Demographics | Rating | Rank | Hearing Disability |
| Immigrants | North Macedonia | 19.1 /100 | #200 | Poor 3.1% |
| Iraqis | 19.0 /100 | #201 | Poor 3.1% |
| Immigrants | Thailand | 16.4 /100 | #202 | Poor 3.1% |
| Immigrants | Denmark | 16.2 /100 | #203 | Poor 3.1% |
| Immigrants | Czechoslovakia | 15.9 /100 | #204 | Poor 3.1% |
| Alsatians | 15.9 /100 | #205 | Poor 3.1% |
| Eastern Europeans | 15.5 /100 | #206 | Poor 3.1% |
| Hispanics or Latinos | 15.1 /100 | #207 | Poor 3.1% |
| Immigrants | Latvia | 12.7 /100 | #208 | Poor 3.1% |
| Immigrants | Hungary | 12.5 /100 | #209 | Poor 3.1% |
| Cape Verdeans | 12.2 /100 | #210 | Poor 3.1% |
| Romanians | 12.1 /100 | #211 | Poor 3.1% |
| Pakistanis | 11.1 /100 | #212 | Poor 3.1% |
| Immigrants | Iraq | 10.5 /100 | #213 | Poor 3.1% |
| Australians | 8.1 /100 | #214 | Tragic 3.2% |