Hungarian vs Hispanic or Latino Hearing Disability
COMPARE
Hungarian
Hispanic or Latino
Hearing Disability
Hearing Disability Comparison
Hungarians
Hispanics or Latinos
3.4%
HEARING DISABILITY
0.4/ 100
METRIC RATING
251st/ 347
METRIC RANK
3.1%
HEARING DISABILITY
15.1/ 100
METRIC RATING
207th/ 347
METRIC RANK
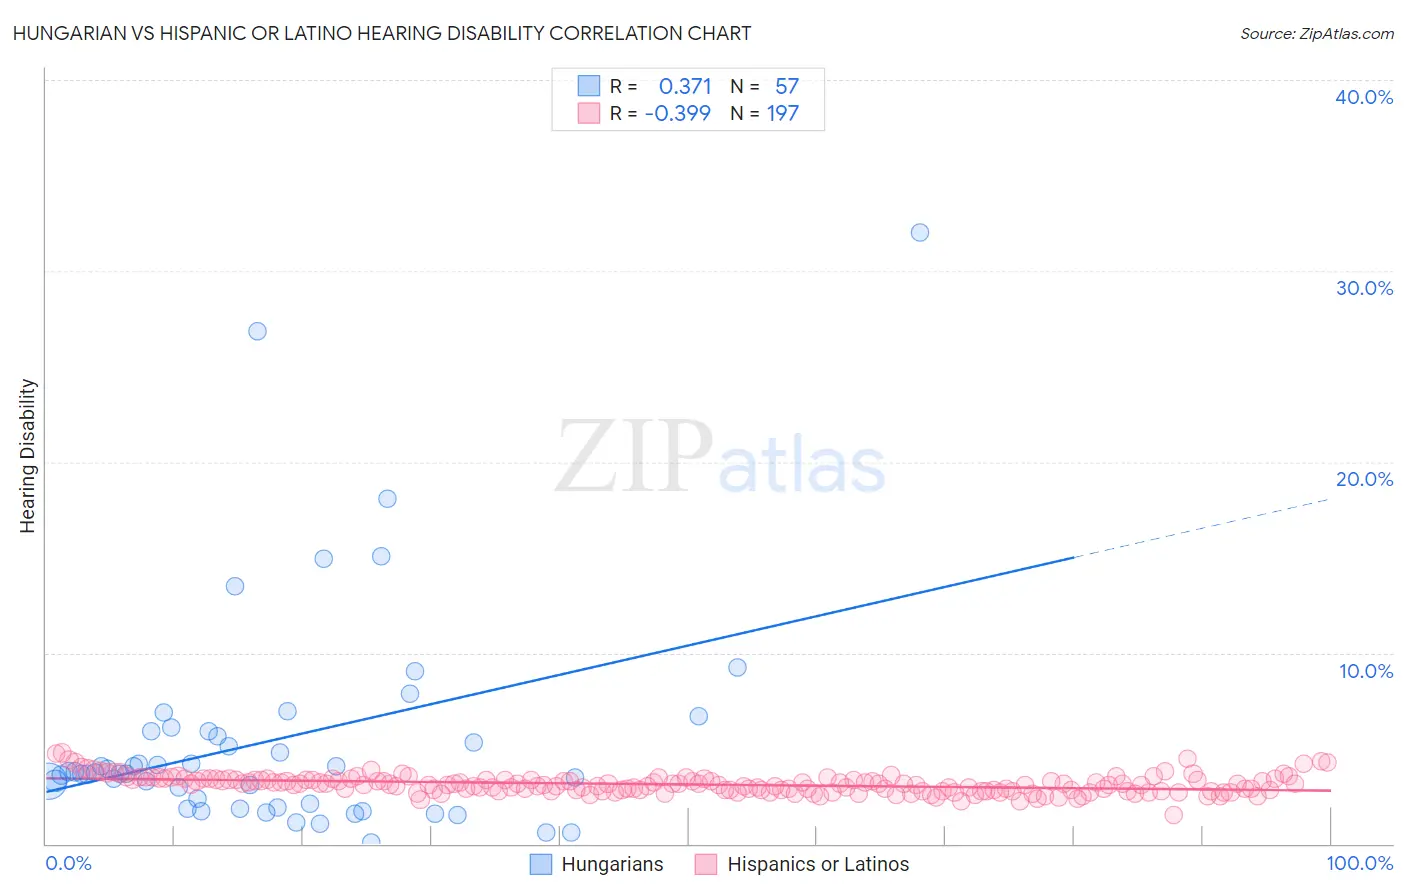
Hungarian vs Hispanic or Latino Hearing Disability Correlation Chart
The statistical analysis conducted on geographies consisting of 485,961,272 people shows a mild positive correlation between the proportion of Hungarians and percentage of population with hearing disability in the United States with a correlation coefficient (R) of 0.371 and weighted average of 3.4%. Similarly, the statistical analysis conducted on geographies consisting of 570,237,836 people shows a mild negative correlation between the proportion of Hispanics or Latinos and percentage of population with hearing disability in the United States with a correlation coefficient (R) of -0.399 and weighted average of 3.1%, a difference of 8.6%.
Hearing Disability Correlation Summary
| Measurement | Hungarian | Hispanic or Latino |
| Minimum | 0.091% | 1.5% |
| Maximum | 32.0% | 4.8% |
| Range | 31.9% | 3.2% |
| Mean | 5.4% | 3.1% |
| Median | 3.7% | 3.1% |
| Interquartile 25% (IQ1) | 2.0% | 2.8% |
| Interquartile 75% (IQ3) | 5.9% | 3.4% |
| Interquartile Range (IQR) | 3.9% | 0.57% |
| Standard Deviation (Sample) | 5.9% | 0.46% |
| Standard Deviation (Population) | 5.8% | 0.46% |
Similar Demographics by Hearing Disability
Demographics Similar to Hungarians by Hearing Disability
In terms of hearing disability, the demographic groups most similar to Hungarians are Croatian (3.4%, a difference of 0.21%), Yuman (3.4%, a difference of 0.23%), Italian (3.4%, a difference of 0.24%), Carpatho Rusyn (3.4%, a difference of 0.66%), and Austrian (3.4%, a difference of 0.77%).
| Demographics | Rating | Rank | Hearing Disability |
| Assyrians/Chaldeans/Syriacs | 0.9 /100 | #244 | Tragic 3.3% |
| Immigrants | Scotland | 0.8 /100 | #245 | Tragic 3.3% |
| Immigrants | England | 0.7 /100 | #246 | Tragic 3.3% |
| Lithuanians | 0.6 /100 | #247 | Tragic 3.4% |
| Austrians | 0.6 /100 | #248 | Tragic 3.4% |
| Italians | 0.4 /100 | #249 | Tragic 3.4% |
| Yuman | 0.4 /100 | #250 | Tragic 3.4% |
| Hungarians | 0.4 /100 | #251 | Tragic 3.4% |
| Croatians | 0.4 /100 | #252 | Tragic 3.4% |
| Carpatho Rusyns | 0.3 /100 | #253 | Tragic 3.4% |
| Slavs | 0.2 /100 | #254 | Tragic 3.4% |
| Poles | 0.2 /100 | #255 | Tragic 3.4% |
| Hmong | 0.2 /100 | #256 | Tragic 3.4% |
| Yaqui | 0.2 /100 | #257 | Tragic 3.4% |
| Northern Europeans | 0.2 /100 | #258 | Tragic 3.4% |
Demographics Similar to Hispanics or Latinos by Hearing Disability
In terms of hearing disability, the demographic groups most similar to Hispanics or Latinos are Eastern European (3.1%, a difference of 0.070%), Immigrants from Czechoslovakia (3.1%, a difference of 0.13%), Alsatian (3.1%, a difference of 0.13%), Immigrants from Denmark (3.1%, a difference of 0.18%), and Immigrants from Thailand (3.1%, a difference of 0.22%).
| Demographics | Rating | Rank | Hearing Disability |
| Immigrants | North Macedonia | 19.1 /100 | #200 | Poor 3.1% |
| Iraqis | 19.0 /100 | #201 | Poor 3.1% |
| Immigrants | Thailand | 16.4 /100 | #202 | Poor 3.1% |
| Immigrants | Denmark | 16.2 /100 | #203 | Poor 3.1% |
| Immigrants | Czechoslovakia | 15.9 /100 | #204 | Poor 3.1% |
| Alsatians | 15.9 /100 | #205 | Poor 3.1% |
| Eastern Europeans | 15.5 /100 | #206 | Poor 3.1% |
| Hispanics or Latinos | 15.1 /100 | #207 | Poor 3.1% |
| Immigrants | Latvia | 12.7 /100 | #208 | Poor 3.1% |
| Immigrants | Hungary | 12.5 /100 | #209 | Poor 3.1% |
| Cape Verdeans | 12.2 /100 | #210 | Poor 3.1% |
| Romanians | 12.1 /100 | #211 | Poor 3.1% |
| Pakistanis | 11.1 /100 | #212 | Poor 3.1% |
| Immigrants | Iraq | 10.5 /100 | #213 | Poor 3.1% |
| Australians | 8.1 /100 | #214 | Tragic 3.2% |