Ottawa vs Immigrants from Serbia Hearing Disability
COMPARE
Ottawa
Immigrants from Serbia
Hearing Disability
Hearing Disability Comparison
Ottawa
Immigrants from Serbia
3.8%
HEARING DISABILITY
0.0/ 100
METRIC RATING
308th/ 347
METRIC RANK
3.0%
HEARING DISABILITY
51.1/ 100
METRIC RATING
173rd/ 347
METRIC RANK
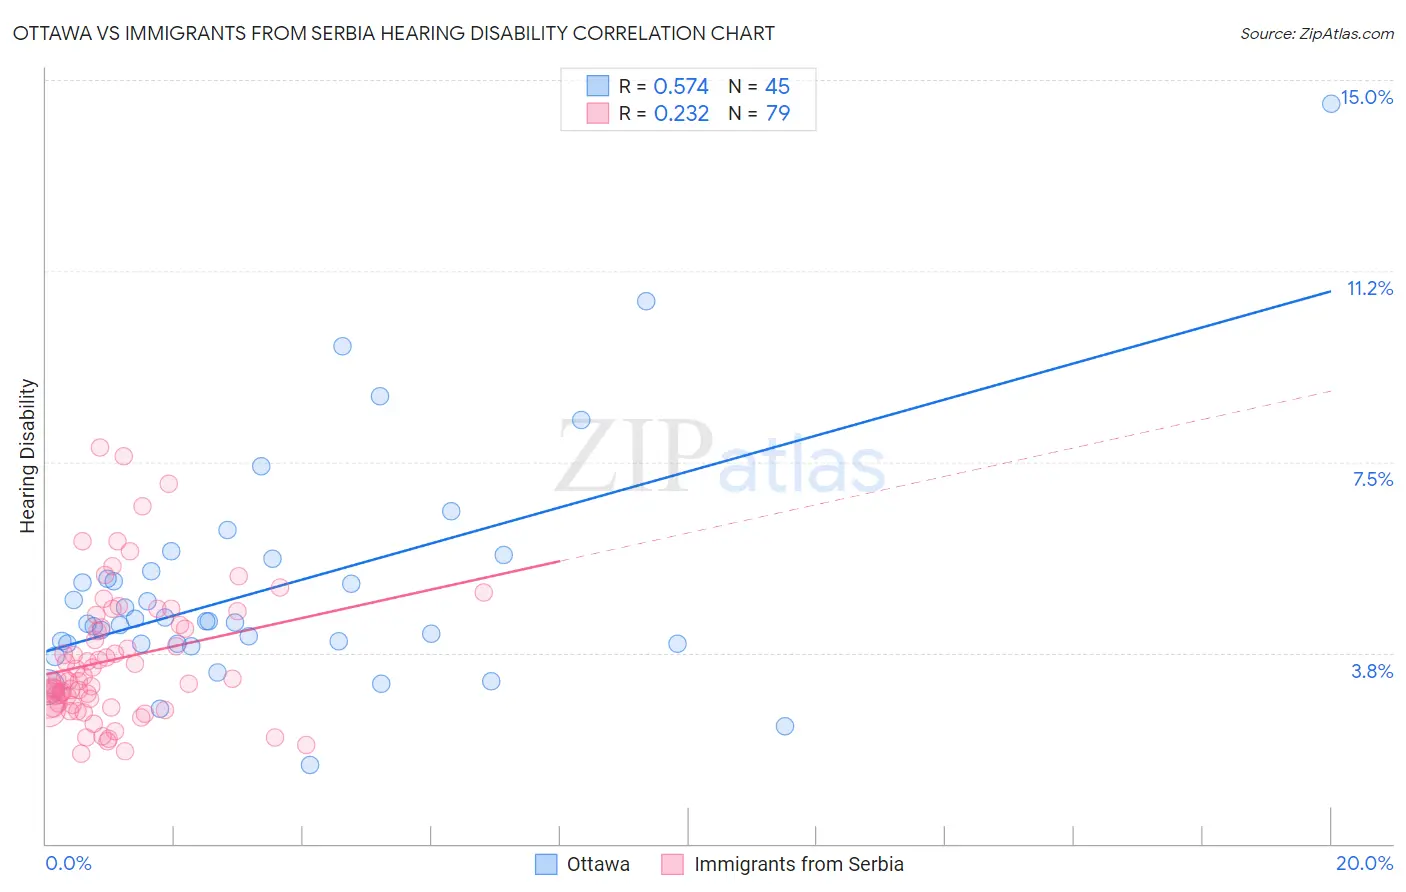
Ottawa vs Immigrants from Serbia Hearing Disability Correlation Chart
The statistical analysis conducted on geographies consisting of 49,954,847 people shows a substantial positive correlation between the proportion of Ottawa and percentage of population with hearing disability in the United States with a correlation coefficient (R) of 0.574 and weighted average of 3.8%. Similarly, the statistical analysis conducted on geographies consisting of 131,744,668 people shows a weak positive correlation between the proportion of Immigrants from Serbia and percentage of population with hearing disability in the United States with a correlation coefficient (R) of 0.232 and weighted average of 3.0%, a difference of 28.0%.
Hearing Disability Correlation Summary
| Measurement | Ottawa | Immigrants from Serbia |
| Minimum | 1.5% | 1.8% |
| Maximum | 14.5% | 7.8% |
| Range | 13.0% | 6.0% |
| Mean | 5.0% | 3.6% |
| Median | 4.4% | 3.2% |
| Interquartile 25% (IQ1) | 3.9% | 2.7% |
| Interquartile 75% (IQ3) | 5.5% | 4.3% |
| Interquartile Range (IQR) | 1.5% | 1.6% |
| Standard Deviation (Sample) | 2.3% | 1.3% |
| Standard Deviation (Population) | 2.3% | 1.3% |
Similar Demographics by Hearing Disability
Demographics Similar to Ottawa by Hearing Disability
In terms of hearing disability, the demographic groups most similar to Ottawa are Scotch-Irish (3.8%, a difference of 0.080%), Cree (3.8%, a difference of 0.39%), French Canadian (3.8%, a difference of 0.44%), Marshallese (3.8%, a difference of 0.56%), and English (3.8%, a difference of 1.4%).
| Demographics | Rating | Rank | Hearing Disability |
| Pennsylvania Germans | 0.0 /100 | #301 | Tragic 3.7% |
| Dutch | 0.0 /100 | #302 | Tragic 3.7% |
| Menominee | 0.0 /100 | #303 | Tragic 3.7% |
| French | 0.0 /100 | #304 | Tragic 3.8% |
| English | 0.0 /100 | #305 | Tragic 3.8% |
| Marshallese | 0.0 /100 | #306 | Tragic 3.8% |
| French Canadians | 0.0 /100 | #307 | Tragic 3.8% |
| Ottawa | 0.0 /100 | #308 | Tragic 3.8% |
| Scotch-Irish | 0.0 /100 | #309 | Tragic 3.8% |
| Cree | 0.0 /100 | #310 | Tragic 3.8% |
| Americans | 0.0 /100 | #311 | Tragic 3.9% |
| Cajuns | 0.0 /100 | #312 | Tragic 3.9% |
| Hopi | 0.0 /100 | #313 | Tragic 3.9% |
| Yakama | 0.0 /100 | #314 | Tragic 3.9% |
| Puget Sound Salish | 0.0 /100 | #315 | Tragic 3.9% |
Demographics Similar to Immigrants from Serbia by Hearing Disability
In terms of hearing disability, the demographic groups most similar to Immigrants from Serbia are Indonesian (3.0%, a difference of 0.10%), Immigrants from Romania (3.0%, a difference of 0.25%), Panamanian (3.0%, a difference of 0.38%), Immigrants from Philippines (3.0%, a difference of 0.44%), and Armenian (3.0%, a difference of 0.47%).
| Demographics | Rating | Rank | Hearing Disability |
| Immigrants | South Eastern Asia | 62.9 /100 | #166 | Good 3.0% |
| Immigrants | Eastern Europe | 58.1 /100 | #167 | Average 3.0% |
| Immigrants | Greece | 57.9 /100 | #168 | Average 3.0% |
| Arabs | 57.6 /100 | #169 | Average 3.0% |
| Immigrants | Cabo Verde | 56.9 /100 | #170 | Average 3.0% |
| Immigrants | Ukraine | 56.6 /100 | #171 | Average 3.0% |
| Armenians | 56.0 /100 | #172 | Average 3.0% |
| Immigrants | Serbia | 51.1 /100 | #173 | Average 3.0% |
| Indonesians | 50.0 /100 | #174 | Average 3.0% |
| Immigrants | Romania | 48.4 /100 | #175 | Average 3.0% |
| Panamanians | 47.0 /100 | #176 | Average 3.0% |
| Immigrants | Philippines | 46.4 /100 | #177 | Average 3.0% |
| Japanese | 46.0 /100 | #178 | Average 3.0% |
| Immigrants | Moldova | 43.1 /100 | #179 | Average 3.0% |
| Immigrants | Sweden | 42.4 /100 | #180 | Average 3.0% |