Ottawa vs Tohono O'odham Hearing Disability
COMPARE
Ottawa
Tohono O'odham
Hearing Disability
Hearing Disability Comparison
Ottawa
Tohono O'odham
3.8%
HEARING DISABILITY
0.0/ 100
METRIC RATING
308th/ 347
METRIC RANK
4.2%
HEARING DISABILITY
0.0/ 100
METRIC RATING
328th/ 347
METRIC RANK
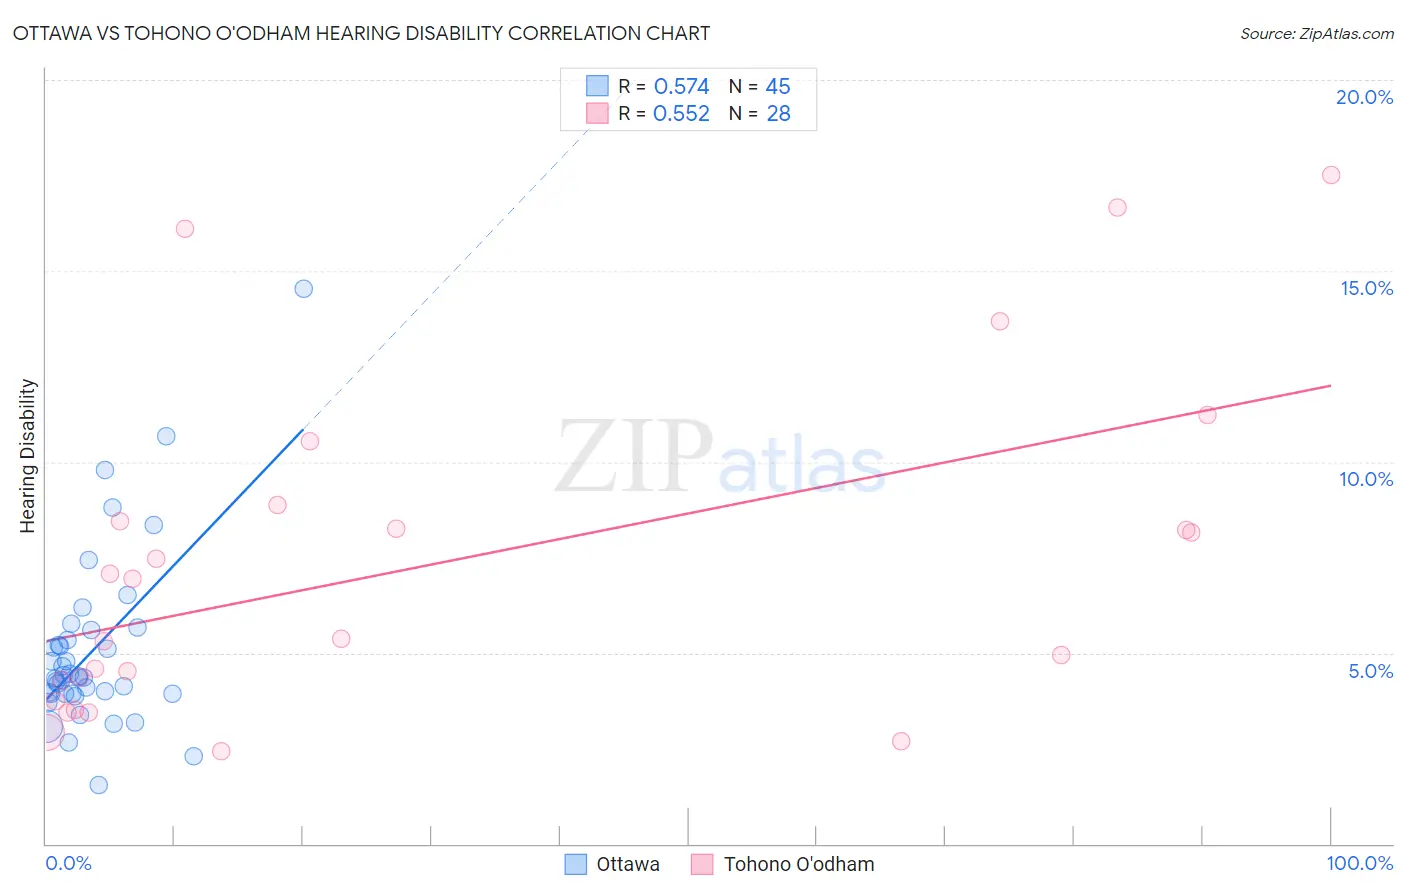
Ottawa vs Tohono O'odham Hearing Disability Correlation Chart
The statistical analysis conducted on geographies consisting of 49,954,847 people shows a substantial positive correlation between the proportion of Ottawa and percentage of population with hearing disability in the United States with a correlation coefficient (R) of 0.574 and weighted average of 3.8%. Similarly, the statistical analysis conducted on geographies consisting of 58,715,422 people shows a substantial positive correlation between the proportion of Tohono O'odham and percentage of population with hearing disability in the United States with a correlation coefficient (R) of 0.552 and weighted average of 4.2%, a difference of 8.8%.
Hearing Disability Correlation Summary
| Measurement | Ottawa | Tohono O'odham |
| Minimum | 1.5% | 2.4% |
| Maximum | 14.5% | 17.5% |
| Range | 13.0% | 15.1% |
| Mean | 5.0% | 7.3% |
| Median | 4.4% | 6.1% |
| Interquartile 25% (IQ1) | 3.9% | 4.0% |
| Interquartile 75% (IQ3) | 5.5% | 8.7% |
| Interquartile Range (IQR) | 1.5% | 4.7% |
| Standard Deviation (Sample) | 2.3% | 4.3% |
| Standard Deviation (Population) | 2.3% | 4.3% |
Demographics Similar to Ottawa and Tohono O'odham by Hearing Disability
In terms of hearing disability, the demographic groups most similar to Ottawa are Scotch-Irish (3.8%, a difference of 0.080%), Cree (3.8%, a difference of 0.39%), American (3.9%, a difference of 1.7%), Cajun (3.9%, a difference of 2.8%), and Hopi (3.9%, a difference of 2.9%). Similarly, the demographic groups most similar to Tohono O'odham are Arapaho (4.1%, a difference of 0.38%), Potawatomi (4.1%, a difference of 1.1%), Lumbee (4.1%, a difference of 1.4%), Osage (4.1%, a difference of 1.7%), and Apache (4.1%, a difference of 1.8%).
| Demographics | Rating | Rank | Hearing Disability |
| Ottawa | 0.0 /100 | #308 | Tragic 3.8% |
| Scotch-Irish | 0.0 /100 | #309 | Tragic 3.8% |
| Cree | 0.0 /100 | #310 | Tragic 3.8% |
| Americans | 0.0 /100 | #311 | Tragic 3.9% |
| Cajuns | 0.0 /100 | #312 | Tragic 3.9% |
| Hopi | 0.0 /100 | #313 | Tragic 3.9% |
| Yakama | 0.0 /100 | #314 | Tragic 3.9% |
| Puget Sound Salish | 0.0 /100 | #315 | Tragic 3.9% |
| Spanish Americans | 0.0 /100 | #316 | Tragic 4.0% |
| Comanche | 0.0 /100 | #317 | Tragic 4.0% |
| Cheyenne | 0.0 /100 | #318 | Tragic 4.0% |
| Chippewa | 0.0 /100 | #319 | Tragic 4.0% |
| Shoshone | 0.0 /100 | #320 | Tragic 4.0% |
| Paiute | 0.0 /100 | #321 | Tragic 4.1% |
| Seminole | 0.0 /100 | #322 | Tragic 4.1% |
| Apache | 0.0 /100 | #323 | Tragic 4.1% |
| Osage | 0.0 /100 | #324 | Tragic 4.1% |
| Lumbee | 0.0 /100 | #325 | Tragic 4.1% |
| Potawatomi | 0.0 /100 | #326 | Tragic 4.1% |
| Arapaho | 0.0 /100 | #327 | Tragic 4.1% |
| Tohono O'odham | 0.0 /100 | #328 | Tragic 4.2% |