Ottawa vs Hispanic or Latino College, 1 year or more
COMPARE
Ottawa
Hispanic or Latino
College, 1 year or more
College, 1 year or more Comparison
Ottawa
Hispanics or Latinos
54.9%
COLLEGE, 1 YEAR OR MORE
0.3/ 100
METRIC RATING
261st/ 347
METRIC RANK
51.1%
COLLEGE, 1 YEAR OR MORE
0.0/ 100
METRIC RATING
317th/ 347
METRIC RANK
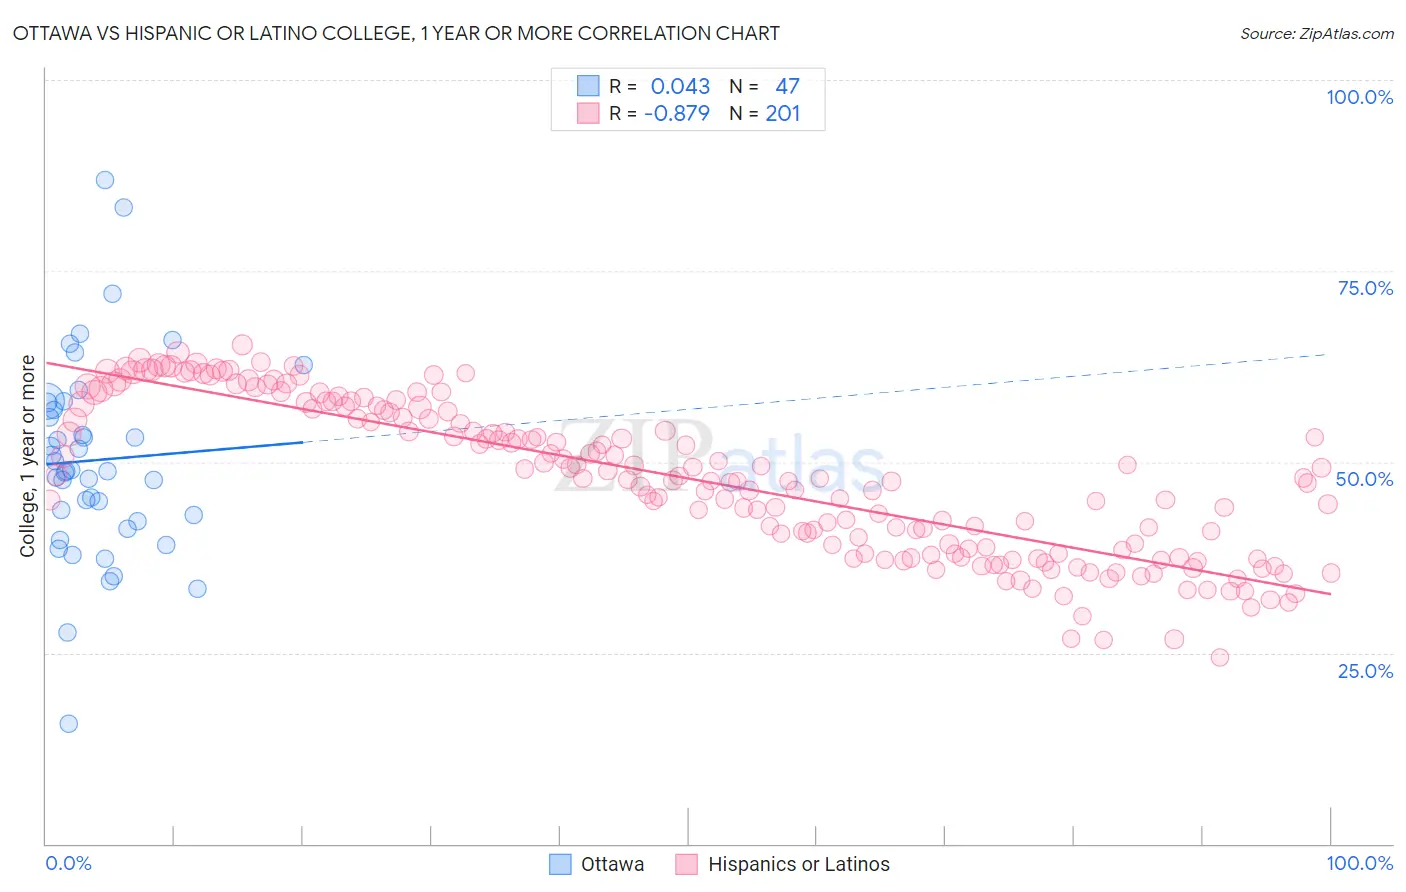
Ottawa vs Hispanic or Latino College, 1 year or more Correlation Chart
The statistical analysis conducted on geographies consisting of 49,956,602 people shows no correlation between the proportion of Ottawa and percentage of population with at least college, 1 year or more education in the United States with a correlation coefficient (R) of 0.043 and weighted average of 54.9%. Similarly, the statistical analysis conducted on geographies consisting of 578,586,619 people shows a very strong negative correlation between the proportion of Hispanics or Latinos and percentage of population with at least college, 1 year or more education in the United States with a correlation coefficient (R) of -0.879 and weighted average of 51.1%, a difference of 7.3%.
College, 1 year or more Correlation Summary
| Measurement | Ottawa | Hispanic or Latino |
| Minimum | 15.7% | 24.4% |
| Maximum | 86.9% | 65.3% |
| Range | 71.3% | 40.9% |
| Mean | 50.2% | 47.8% |
| Median | 48.8% | 47.8% |
| Interquartile 25% (IQ1) | 42.2% | 38.2% |
| Interquartile 75% (IQ3) | 57.7% | 57.0% |
| Interquartile Range (IQR) | 15.5% | 18.8% |
| Standard Deviation (Sample) | 13.1% | 10.0% |
| Standard Deviation (Population) | 13.0% | 10.0% |
Similar Demographics by College, 1 year or more
Demographics Similar to Ottawa by College, 1 year or more
In terms of college, 1 year or more, the demographic groups most similar to Ottawa are Jamaican (54.9%, a difference of 0.030%), Immigrants from St. Vincent and the Grenadines (54.8%, a difference of 0.080%), U.S. Virgin Islander (54.8%, a difference of 0.11%), Nepalese (54.9%, a difference of 0.13%), and Immigrants from Micronesia (54.8%, a difference of 0.13%).
| Demographics | Rating | Rank | College, 1 year or more |
| Japanese | 0.5 /100 | #254 | Tragic 55.2% |
| Immigrants | Bahamas | 0.5 /100 | #255 | Tragic 55.2% |
| Immigrants | West Indies | 0.5 /100 | #256 | Tragic 55.2% |
| Indonesians | 0.4 /100 | #257 | Tragic 55.1% |
| Africans | 0.4 /100 | #258 | Tragic 55.0% |
| Nepalese | 0.3 /100 | #259 | Tragic 54.9% |
| Jamaicans | 0.3 /100 | #260 | Tragic 54.9% |
| Ottawa | 0.3 /100 | #261 | Tragic 54.9% |
| Immigrants | St. Vincent and the Grenadines | 0.3 /100 | #262 | Tragic 54.8% |
| U.S. Virgin Islanders | 0.3 /100 | #263 | Tragic 54.8% |
| Immigrants | Micronesia | 0.3 /100 | #264 | Tragic 54.8% |
| Immigrants | Laos | 0.2 /100 | #265 | Tragic 54.7% |
| Potawatomi | 0.2 /100 | #266 | Tragic 54.6% |
| Blackfeet | 0.2 /100 | #267 | Tragic 54.6% |
| British West Indians | 0.2 /100 | #268 | Tragic 54.5% |
Demographics Similar to Hispanics or Latinos by College, 1 year or more
In terms of college, 1 year or more, the demographic groups most similar to Hispanics or Latinos are Cajun (51.2%, a difference of 0.090%), Immigrants from Honduras (51.0%, a difference of 0.13%), Guatemalan (51.2%, a difference of 0.16%), Immigrants from El Salvador (51.0%, a difference of 0.22%), and Kiowa (51.0%, a difference of 0.28%).
| Demographics | Rating | Rank | College, 1 year or more |
| Hondurans | 0.0 /100 | #310 | Tragic 51.6% |
| Immigrants | Haiti | 0.0 /100 | #311 | Tragic 51.5% |
| Pueblo | 0.0 /100 | #312 | Tragic 51.5% |
| Immigrants | Caribbean | 0.0 /100 | #313 | Tragic 51.4% |
| Fijians | 0.0 /100 | #314 | Tragic 51.3% |
| Guatemalans | 0.0 /100 | #315 | Tragic 51.2% |
| Cajuns | 0.0 /100 | #316 | Tragic 51.2% |
| Hispanics or Latinos | 0.0 /100 | #317 | Tragic 51.1% |
| Immigrants | Honduras | 0.0 /100 | #318 | Tragic 51.0% |
| Immigrants | El Salvador | 0.0 /100 | #319 | Tragic 51.0% |
| Kiowa | 0.0 /100 | #320 | Tragic 51.0% |
| Hopi | 0.0 /100 | #321 | Tragic 50.9% |
| Navajo | 0.0 /100 | #322 | Tragic 50.8% |
| Immigrants | Guatemala | 0.0 /100 | #323 | Tragic 50.7% |
| Immigrants | Cuba | 0.0 /100 | #324 | Tragic 50.7% |