Immigrants from Ecuador vs Hispanic or Latino Hearing Disability
COMPARE
Immigrants from Ecuador
Hispanic or Latino
Hearing Disability
Hearing Disability Comparison
Immigrants from Ecuador
Hispanics or Latinos
2.5%
HEARING DISABILITY
99.9/ 100
METRIC RATING
10th/ 347
METRIC RANK
3.1%
HEARING DISABILITY
15.1/ 100
METRIC RATING
207th/ 347
METRIC RANK
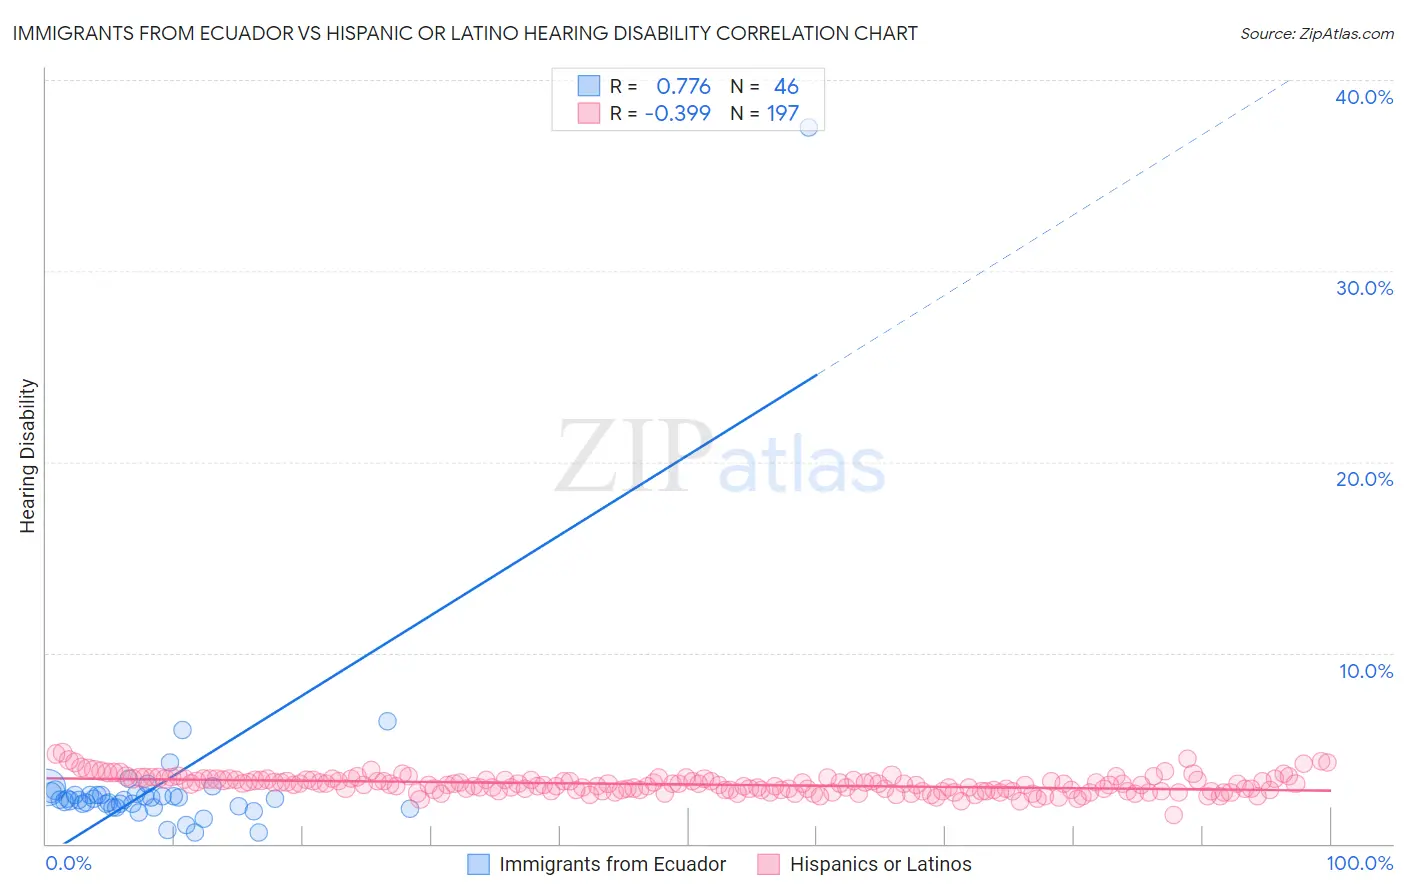
Immigrants from Ecuador vs Hispanic or Latino Hearing Disability Correlation Chart
The statistical analysis conducted on geographies consisting of 270,917,145 people shows a strong positive correlation between the proportion of Immigrants from Ecuador and percentage of population with hearing disability in the United States with a correlation coefficient (R) of 0.776 and weighted average of 2.5%. Similarly, the statistical analysis conducted on geographies consisting of 570,237,836 people shows a mild negative correlation between the proportion of Hispanics or Latinos and percentage of population with hearing disability in the United States with a correlation coefficient (R) of -0.399 and weighted average of 3.1%, a difference of 26.0%.
Hearing Disability Correlation Summary
| Measurement | Immigrants from Ecuador | Hispanic or Latino |
| Minimum | 0.57% | 1.5% |
| Maximum | 37.5% | 4.8% |
| Range | 36.9% | 3.2% |
| Mean | 3.2% | 3.1% |
| Median | 2.3% | 3.1% |
| Interquartile 25% (IQ1) | 2.0% | 2.8% |
| Interquartile 75% (IQ3) | 2.6% | 3.4% |
| Interquartile Range (IQR) | 0.59% | 0.57% |
| Standard Deviation (Sample) | 5.3% | 0.46% |
| Standard Deviation (Population) | 5.2% | 0.46% |
Similar Demographics by Hearing Disability
Demographics Similar to Immigrants from Ecuador by Hearing Disability
In terms of hearing disability, the demographic groups most similar to Immigrants from Ecuador are Immigrants from Trinidad and Tobago (2.5%, a difference of 0.55%), Trinidadian and Tobagonian (2.5%, a difference of 0.86%), Immigrants from Dominican Republic (2.4%, a difference of 1.0%), Sierra Leonean (2.5%, a difference of 1.1%), and Ecuadorian (2.5%, a difference of 1.4%).
| Demographics | Rating | Rank | Hearing Disability |
| Guyanese | 100.0 /100 | #3 | Exceptional 2.3% |
| Immigrants | Guyana | 100.0 /100 | #4 | Exceptional 2.3% |
| Immigrants | Barbados | 100.0 /100 | #5 | Exceptional 2.4% |
| Vietnamese | 100.0 /100 | #6 | Exceptional 2.4% |
| Immigrants | Bangladesh | 100.0 /100 | #7 | Exceptional 2.4% |
| British West Indians | 100.0 /100 | #8 | Exceptional 2.4% |
| Immigrants | Dominican Republic | 100.0 /100 | #9 | Exceptional 2.4% |
| Immigrants | Ecuador | 99.9 /100 | #10 | Exceptional 2.5% |
| Immigrants | Trinidad and Tobago | 99.9 /100 | #11 | Exceptional 2.5% |
| Trinidadians and Tobagonians | 99.9 /100 | #12 | Exceptional 2.5% |
| Sierra Leoneans | 99.9 /100 | #13 | Exceptional 2.5% |
| Ecuadorians | 99.9 /100 | #14 | Exceptional 2.5% |
| Barbadians | 99.9 /100 | #15 | Exceptional 2.5% |
| Immigrants | West Indies | 99.9 /100 | #16 | Exceptional 2.5% |
| Immigrants | India | 99.9 /100 | #17 | Exceptional 2.5% |
Demographics Similar to Hispanics or Latinos by Hearing Disability
In terms of hearing disability, the demographic groups most similar to Hispanics or Latinos are Eastern European (3.1%, a difference of 0.070%), Immigrants from Czechoslovakia (3.1%, a difference of 0.13%), Alsatian (3.1%, a difference of 0.13%), Immigrants from Denmark (3.1%, a difference of 0.18%), and Immigrants from Thailand (3.1%, a difference of 0.22%).
| Demographics | Rating | Rank | Hearing Disability |
| Immigrants | North Macedonia | 19.1 /100 | #200 | Poor 3.1% |
| Iraqis | 19.0 /100 | #201 | Poor 3.1% |
| Immigrants | Thailand | 16.4 /100 | #202 | Poor 3.1% |
| Immigrants | Denmark | 16.2 /100 | #203 | Poor 3.1% |
| Immigrants | Czechoslovakia | 15.9 /100 | #204 | Poor 3.1% |
| Alsatians | 15.9 /100 | #205 | Poor 3.1% |
| Eastern Europeans | 15.5 /100 | #206 | Poor 3.1% |
| Hispanics or Latinos | 15.1 /100 | #207 | Poor 3.1% |
| Immigrants | Latvia | 12.7 /100 | #208 | Poor 3.1% |
| Immigrants | Hungary | 12.5 /100 | #209 | Poor 3.1% |
| Cape Verdeans | 12.2 /100 | #210 | Poor 3.1% |
| Romanians | 12.1 /100 | #211 | Poor 3.1% |
| Pakistanis | 11.1 /100 | #212 | Poor 3.1% |
| Immigrants | Iraq | 10.5 /100 | #213 | Poor 3.1% |
| Australians | 8.1 /100 | #214 | Tragic 3.2% |