Ottawa vs Hispanic or Latino Births to Unmarried Women
COMPARE
Ottawa
Hispanic or Latino
Births to Unmarried Women
Births to Unmarried Women Comparison
Ottawa
Hispanics or Latinos
36.5%
BIRTHS TO UNMARRIED WOMEN
0.2/ 100
METRIC RATING
260th/ 347
METRIC RANK
37.8%
BIRTHS TO UNMARRIED WOMEN
0.0/ 100
METRIC RATING
290th/ 347
METRIC RANK
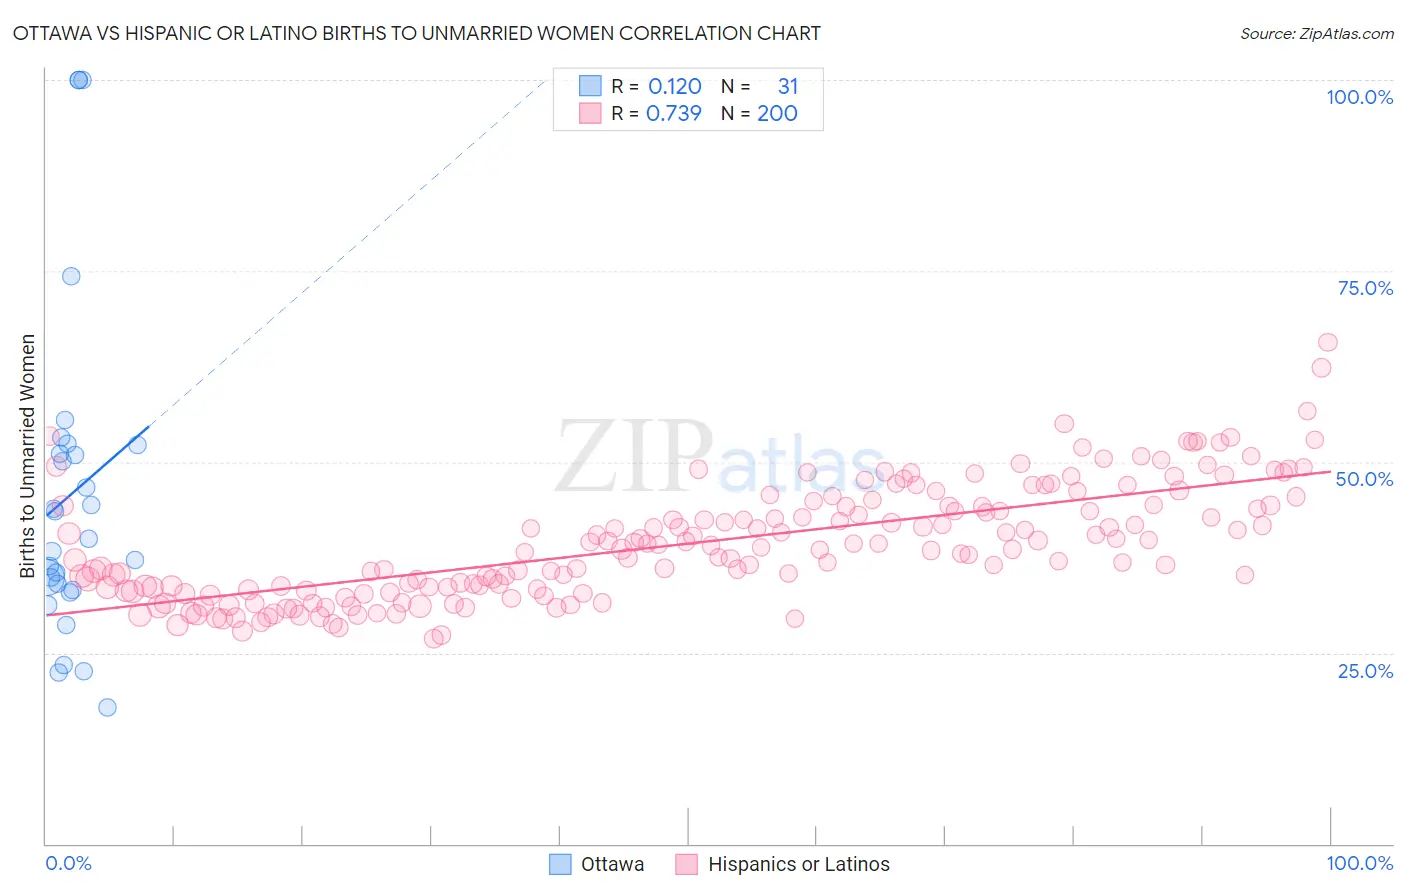
Ottawa vs Hispanic or Latino Births to Unmarried Women Correlation Chart
The statistical analysis conducted on geographies consisting of 48,969,239 people shows a poor positive correlation between the proportion of Ottawa and percentage of births to unmarried women in the United States with a correlation coefficient (R) of 0.120 and weighted average of 36.5%. Similarly, the statistical analysis conducted on geographies consisting of 511,497,668 people shows a strong positive correlation between the proportion of Hispanics or Latinos and percentage of births to unmarried women in the United States with a correlation coefficient (R) of 0.739 and weighted average of 37.8%, a difference of 3.6%.
Births to Unmarried Women Correlation Summary
| Measurement | Ottawa | Hispanic or Latino |
| Minimum | 17.9% | 26.9% |
| Maximum | 100.0% | 65.6% |
| Range | 82.1% | 38.8% |
| Mean | 45.9% | 39.3% |
| Median | 40.0% | 38.7% |
| Interquartile 25% (IQ1) | 33.3% | 33.3% |
| Interquartile 75% (IQ3) | 52.2% | 44.3% |
| Interquartile Range (IQR) | 18.9% | 11.0% |
| Standard Deviation (Sample) | 21.5% | 7.4% |
| Standard Deviation (Population) | 21.2% | 7.4% |
Similar Demographics by Births to Unmarried Women
Demographics Similar to Ottawa by Births to Unmarried Women
In terms of births to unmarried women, the demographic groups most similar to Ottawa are Trinidadian and Tobagonian (36.5%, a difference of 0.0%), Immigrants from El Salvador (36.4%, a difference of 0.12%), American (36.4%, a difference of 0.16%), French American Indian (36.6%, a difference of 0.37%), and Nicaraguan (36.6%, a difference of 0.39%).
| Demographics | Rating | Rank | Births to Unmarried Women |
| Immigrants | Portugal | 0.2 /100 | #253 | Tragic 36.2% |
| Potawatomi | 0.2 /100 | #254 | Tragic 36.2% |
| Chickasaw | 0.2 /100 | #255 | Tragic 36.3% |
| Immigrants | Trinidad and Tobago | 0.2 /100 | #256 | Tragic 36.3% |
| Immigrants | Grenada | 0.2 /100 | #257 | Tragic 36.3% |
| Americans | 0.2 /100 | #258 | Tragic 36.4% |
| Immigrants | El Salvador | 0.2 /100 | #259 | Tragic 36.4% |
| Ottawa | 0.2 /100 | #260 | Tragic 36.5% |
| Trinidadians and Tobagonians | 0.2 /100 | #261 | Tragic 36.5% |
| French American Indians | 0.1 /100 | #262 | Tragic 36.6% |
| Nicaraguans | 0.1 /100 | #263 | Tragic 36.6% |
| Sub-Saharan Africans | 0.1 /100 | #264 | Tragic 36.7% |
| Cherokee | 0.1 /100 | #265 | Tragic 36.7% |
| Immigrants | Senegal | 0.1 /100 | #266 | Tragic 36.7% |
| Central Americans | 0.1 /100 | #267 | Tragic 36.7% |
Demographics Similar to Hispanics or Latinos by Births to Unmarried Women
In terms of births to unmarried women, the demographic groups most similar to Hispanics or Latinos are Alaskan Athabascan (37.7%, a difference of 0.14%), Seminole (37.9%, a difference of 0.34%), Immigrants from Liberia (37.6%, a difference of 0.37%), Blackfeet (37.9%, a difference of 0.39%), and Creek (37.6%, a difference of 0.54%).
| Demographics | Rating | Rank | Births to Unmarried Women |
| Spanish American Indians | 0.0 /100 | #283 | Tragic 37.4% |
| Immigrants | Central America | 0.0 /100 | #284 | Tragic 37.4% |
| Immigrants | Mexico | 0.0 /100 | #285 | Tragic 37.5% |
| Immigrants | Guatemala | 0.0 /100 | #286 | Tragic 37.5% |
| Creek | 0.0 /100 | #287 | Tragic 37.6% |
| Immigrants | Liberia | 0.0 /100 | #288 | Tragic 37.6% |
| Alaskan Athabascans | 0.0 /100 | #289 | Tragic 37.7% |
| Hispanics or Latinos | 0.0 /100 | #290 | Tragic 37.8% |
| Seminole | 0.0 /100 | #291 | Tragic 37.9% |
| Blackfeet | 0.0 /100 | #292 | Tragic 37.9% |
| Immigrants | Nicaragua | 0.0 /100 | #293 | Tragic 38.0% |
| British West Indians | 0.0 /100 | #294 | Tragic 38.0% |
| Iroquois | 0.0 /100 | #295 | Tragic 38.2% |
| Alaska Natives | 0.0 /100 | #296 | Tragic 38.3% |
| Dutch West Indians | 0.0 /100 | #297 | Tragic 38.4% |