Okinawan vs Estonian Hearing Disability
COMPARE
Okinawan
Estonian
Hearing Disability
Hearing Disability Comparison
Okinawans
Estonians
2.6%
HEARING DISABILITY
99.6/ 100
METRIC RATING
36th/ 347
METRIC RANK
3.3%
HEARING DISABILITY
2.4/ 100
METRIC RATING
233rd/ 347
METRIC RANK
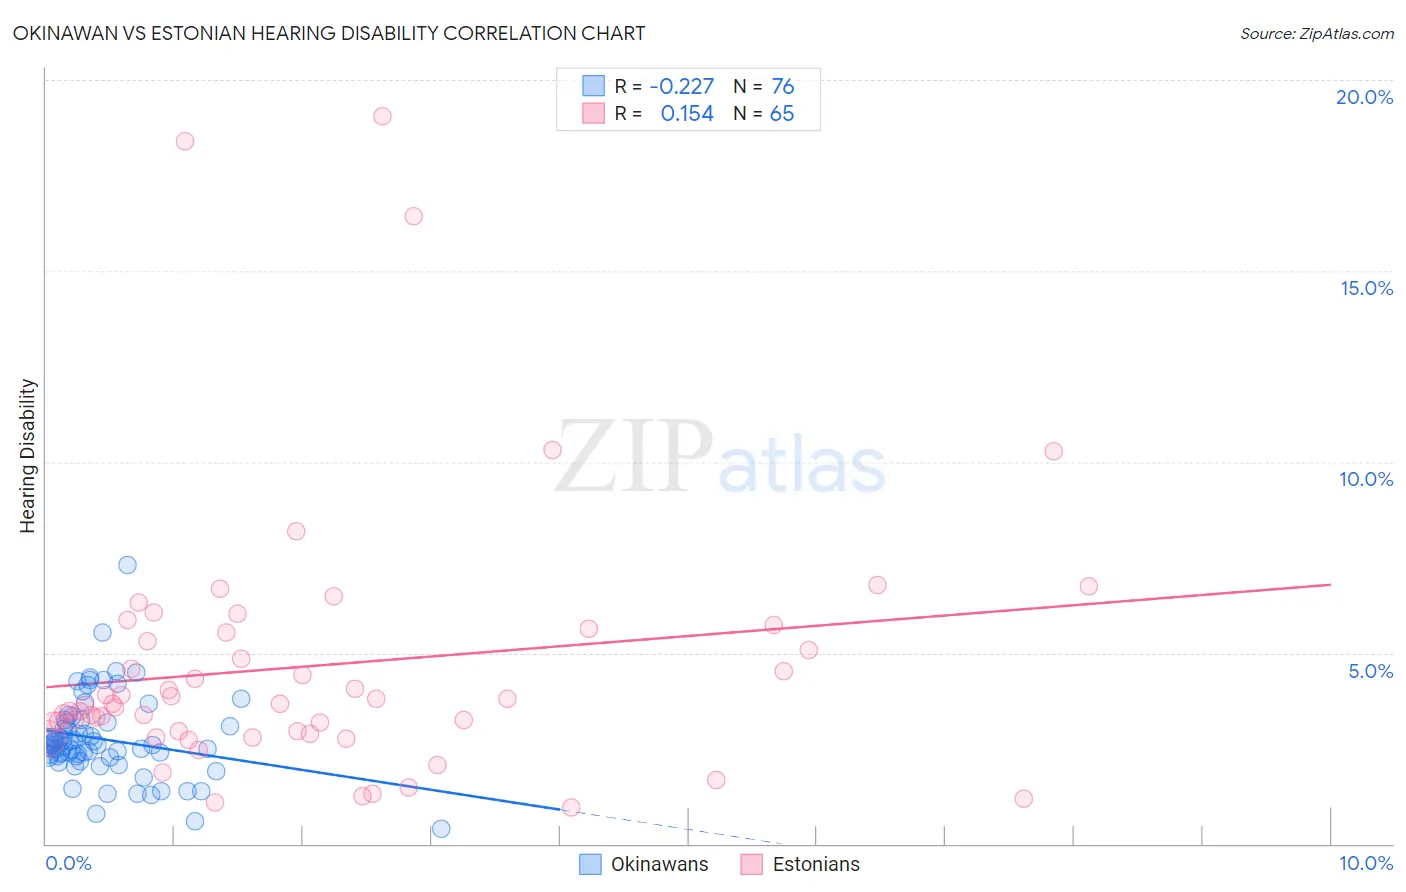
Okinawan vs Estonian Hearing Disability Correlation Chart
The statistical analysis conducted on geographies consisting of 73,759,317 people shows a weak negative correlation between the proportion of Okinawans and percentage of population with hearing disability in the United States with a correlation coefficient (R) of -0.227 and weighted average of 2.6%. Similarly, the statistical analysis conducted on geographies consisting of 123,522,478 people shows a poor positive correlation between the proportion of Estonians and percentage of population with hearing disability in the United States with a correlation coefficient (R) of 0.154 and weighted average of 3.3%, a difference of 24.5%.
Hearing Disability Correlation Summary
| Measurement | Okinawan | Estonian |
| Minimum | 0.40% | 0.96% |
| Maximum | 7.3% | 19.0% |
| Range | 6.9% | 18.1% |
| Mean | 2.7% | 4.7% |
| Median | 2.6% | 3.7% |
| Interquartile 25% (IQ1) | 2.3% | 2.9% |
| Interquartile 75% (IQ3) | 3.2% | 5.6% |
| Interquartile Range (IQR) | 0.90% | 2.7% |
| Standard Deviation (Sample) | 1.1% | 3.5% |
| Standard Deviation (Population) | 1.1% | 3.5% |
Similar Demographics by Hearing Disability
Demographics Similar to Okinawans by Hearing Disability
In terms of hearing disability, the demographic groups most similar to Okinawans are Immigrants from Western Africa (2.6%, a difference of 0.020%), Immigrants from Jamaica (2.6%, a difference of 0.11%), Salvadoran (2.6%, a difference of 0.22%), Immigrants from Pakistan (2.6%, a difference of 0.35%), and Immigrants from China (2.6%, a difference of 0.35%).
| Demographics | Rating | Rank | Hearing Disability |
| Bolivians | 99.7 /100 | #29 | Exceptional 2.6% |
| Immigrants | Caribbean | 99.7 /100 | #30 | Exceptional 2.6% |
| Immigrants | Cameroon | 99.7 /100 | #31 | Exceptional 2.6% |
| Immigrants | Venezuela | 99.7 /100 | #32 | Exceptional 2.6% |
| Filipinos | 99.6 /100 | #33 | Exceptional 2.6% |
| Immigrants | Pakistan | 99.6 /100 | #34 | Exceptional 2.6% |
| Salvadorans | 99.6 /100 | #35 | Exceptional 2.6% |
| Okinawans | 99.6 /100 | #36 | Exceptional 2.6% |
| Immigrants | Western Africa | 99.6 /100 | #37 | Exceptional 2.6% |
| Immigrants | Jamaica | 99.5 /100 | #38 | Exceptional 2.6% |
| Immigrants | China | 99.5 /100 | #39 | Exceptional 2.6% |
| Haitians | 99.5 /100 | #40 | Exceptional 2.6% |
| Immigrants | Taiwan | 99.4 /100 | #41 | Exceptional 2.6% |
| West Indians | 99.4 /100 | #42 | Exceptional 2.6% |
| Senegalese | 99.4 /100 | #43 | Exceptional 2.6% |
Demographics Similar to Estonians by Hearing Disability
In terms of hearing disability, the demographic groups most similar to Estonians are Central American Indian (3.3%, a difference of 0.070%), Guamanian/Chamorro (3.3%, a difference of 0.17%), Serbian (3.3%, a difference of 0.24%), Ukrainian (3.2%, a difference of 0.37%), and Luxembourger (3.2%, a difference of 0.42%).
| Demographics | Rating | Rank | Hearing Disability |
| Lebanese | 5.0 /100 | #226 | Tragic 3.2% |
| Bhutanese | 4.6 /100 | #227 | Tragic 3.2% |
| Immigrants | Portugal | 4.3 /100 | #228 | Tragic 3.2% |
| Maltese | 4.1 /100 | #229 | Tragic 3.2% |
| Greeks | 3.2 /100 | #230 | Tragic 3.2% |
| Luxembourgers | 2.9 /100 | #231 | Tragic 3.2% |
| Ukrainians | 2.9 /100 | #232 | Tragic 3.2% |
| Estonians | 2.4 /100 | #233 | Tragic 3.3% |
| Central American Indians | 2.3 /100 | #234 | Tragic 3.3% |
| Guamanians/Chamorros | 2.2 /100 | #235 | Tragic 3.3% |
| Serbians | 2.2 /100 | #236 | Tragic 3.3% |
| Immigrants | Austria | 1.8 /100 | #237 | Tragic 3.3% |
| German Russians | 1.8 /100 | #238 | Tragic 3.3% |
| Nepalese | 1.2 /100 | #239 | Tragic 3.3% |
| Immigrants | Netherlands | 1.1 /100 | #240 | Tragic 3.3% |