Immigrants from Israel vs Estonian Hearing Disability
COMPARE
Immigrants from Israel
Estonian
Hearing Disability
Hearing Disability Comparison
Immigrants from Israel
Estonians
2.6%
HEARING DISABILITY
99.3/ 100
METRIC RATING
47th/ 347
METRIC RANK
3.3%
HEARING DISABILITY
2.4/ 100
METRIC RATING
233rd/ 347
METRIC RANK
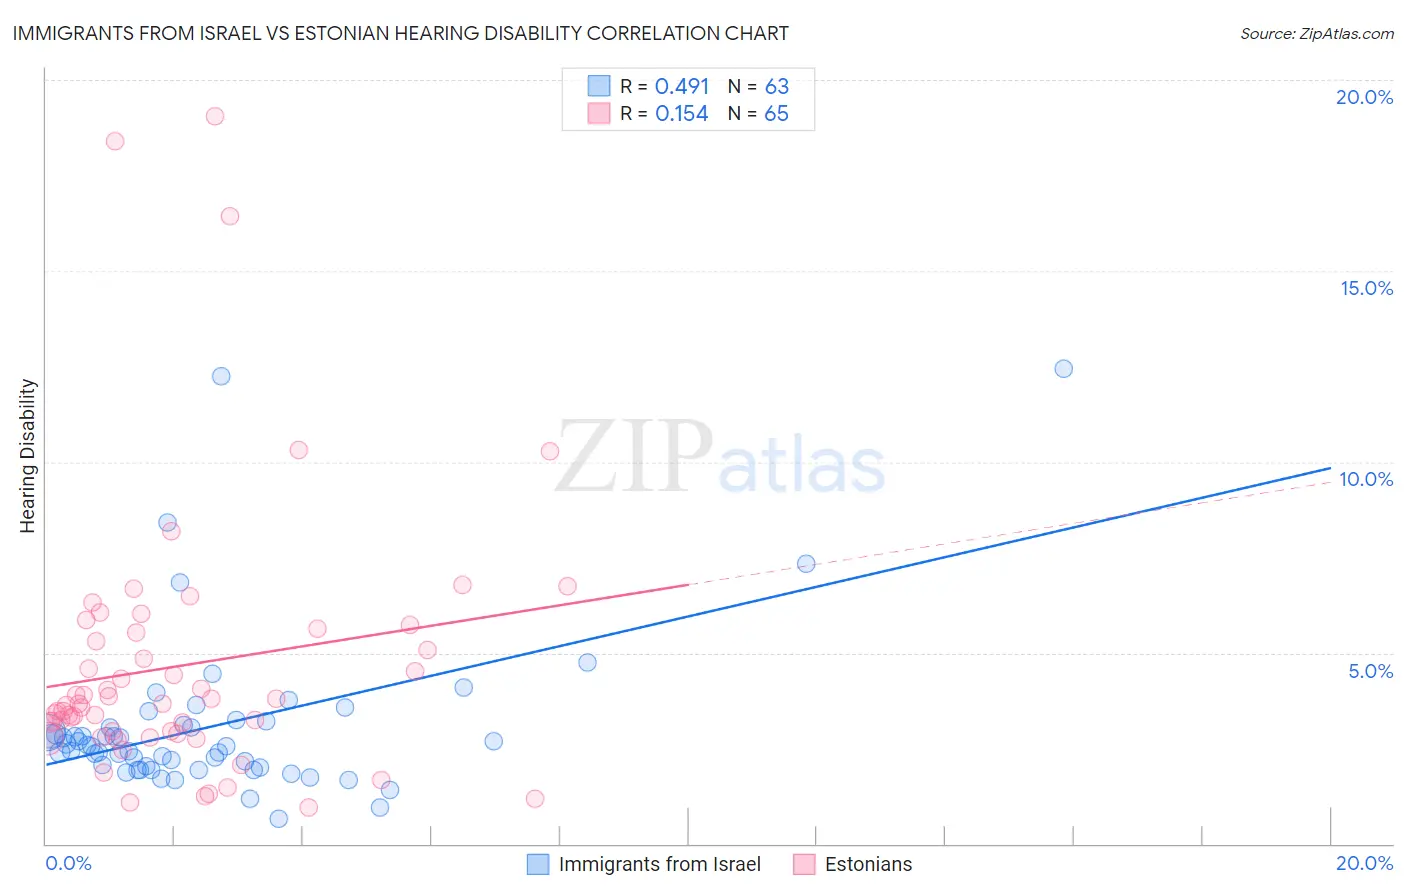
Immigrants from Israel vs Estonian Hearing Disability Correlation Chart
The statistical analysis conducted on geographies consisting of 210,020,073 people shows a moderate positive correlation between the proportion of Immigrants from Israel and percentage of population with hearing disability in the United States with a correlation coefficient (R) of 0.491 and weighted average of 2.6%. Similarly, the statistical analysis conducted on geographies consisting of 123,522,478 people shows a poor positive correlation between the proportion of Estonians and percentage of population with hearing disability in the United States with a correlation coefficient (R) of 0.154 and weighted average of 3.3%, a difference of 22.9%.
Hearing Disability Correlation Summary
| Measurement | Immigrants from Israel | Estonian |
| Minimum | 0.64% | 0.96% |
| Maximum | 12.4% | 19.0% |
| Range | 11.8% | 18.1% |
| Mean | 3.1% | 4.7% |
| Median | 2.5% | 3.7% |
| Interquartile 25% (IQ1) | 2.0% | 2.9% |
| Interquartile 75% (IQ3) | 3.1% | 5.6% |
| Interquartile Range (IQR) | 1.1% | 2.7% |
| Standard Deviation (Sample) | 2.1% | 3.5% |
| Standard Deviation (Population) | 2.1% | 3.5% |
Similar Demographics by Hearing Disability
Demographics Similar to Immigrants from Israel by Hearing Disability
In terms of hearing disability, the demographic groups most similar to Immigrants from Israel are Immigrants from Singapore (2.6%, a difference of 0.070%), Immigrants from Dominica (2.6%, a difference of 0.15%), Immigrants from South America (2.7%, a difference of 0.19%), Venezuelan (2.6%, a difference of 0.25%), and Nigerian (2.6%, a difference of 0.28%).
| Demographics | Rating | Rank | Hearing Disability |
| Haitians | 99.5 /100 | #40 | Exceptional 2.6% |
| Immigrants | Taiwan | 99.4 /100 | #41 | Exceptional 2.6% |
| West Indians | 99.4 /100 | #42 | Exceptional 2.6% |
| Senegalese | 99.4 /100 | #43 | Exceptional 2.6% |
| Nigerians | 99.4 /100 | #44 | Exceptional 2.6% |
| Venezuelans | 99.4 /100 | #45 | Exceptional 2.6% |
| Immigrants | Dominica | 99.3 /100 | #46 | Exceptional 2.6% |
| Immigrants | Israel | 99.3 /100 | #47 | Exceptional 2.6% |
| Immigrants | Singapore | 99.3 /100 | #48 | Exceptional 2.6% |
| Immigrants | South America | 99.2 /100 | #49 | Exceptional 2.7% |
| Paraguayans | 99.2 /100 | #50 | Exceptional 2.7% |
| Immigrants | Hong Kong | 99.2 /100 | #51 | Exceptional 2.7% |
| Jamaicans | 99.0 /100 | #52 | Exceptional 2.7% |
| Immigrants | Eastern Asia | 99.0 /100 | #53 | Exceptional 2.7% |
| Ethiopians | 99.0 /100 | #54 | Exceptional 2.7% |
Demographics Similar to Estonians by Hearing Disability
In terms of hearing disability, the demographic groups most similar to Estonians are Central American Indian (3.3%, a difference of 0.070%), Guamanian/Chamorro (3.3%, a difference of 0.17%), Serbian (3.3%, a difference of 0.24%), Ukrainian (3.2%, a difference of 0.37%), and Luxembourger (3.2%, a difference of 0.42%).
| Demographics | Rating | Rank | Hearing Disability |
| Lebanese | 5.0 /100 | #226 | Tragic 3.2% |
| Bhutanese | 4.6 /100 | #227 | Tragic 3.2% |
| Immigrants | Portugal | 4.3 /100 | #228 | Tragic 3.2% |
| Maltese | 4.1 /100 | #229 | Tragic 3.2% |
| Greeks | 3.2 /100 | #230 | Tragic 3.2% |
| Luxembourgers | 2.9 /100 | #231 | Tragic 3.2% |
| Ukrainians | 2.9 /100 | #232 | Tragic 3.2% |
| Estonians | 2.4 /100 | #233 | Tragic 3.3% |
| Central American Indians | 2.3 /100 | #234 | Tragic 3.3% |
| Guamanians/Chamorros | 2.2 /100 | #235 | Tragic 3.3% |
| Serbians | 2.2 /100 | #236 | Tragic 3.3% |
| Immigrants | Austria | 1.8 /100 | #237 | Tragic 3.3% |
| German Russians | 1.8 /100 | #238 | Tragic 3.3% |
| Nepalese | 1.2 /100 | #239 | Tragic 3.3% |
| Immigrants | Netherlands | 1.1 /100 | #240 | Tragic 3.3% |