Okinawan vs Scottish Hearing Disability
COMPARE
Okinawan
Scottish
Hearing Disability
Hearing Disability Comparison
Okinawans
Scottish
2.6%
HEARING DISABILITY
99.6/ 100
METRIC RATING
36th/ 347
METRIC RANK
3.7%
HEARING DISABILITY
0.0/ 100
METRIC RATING
300th/ 347
METRIC RANK
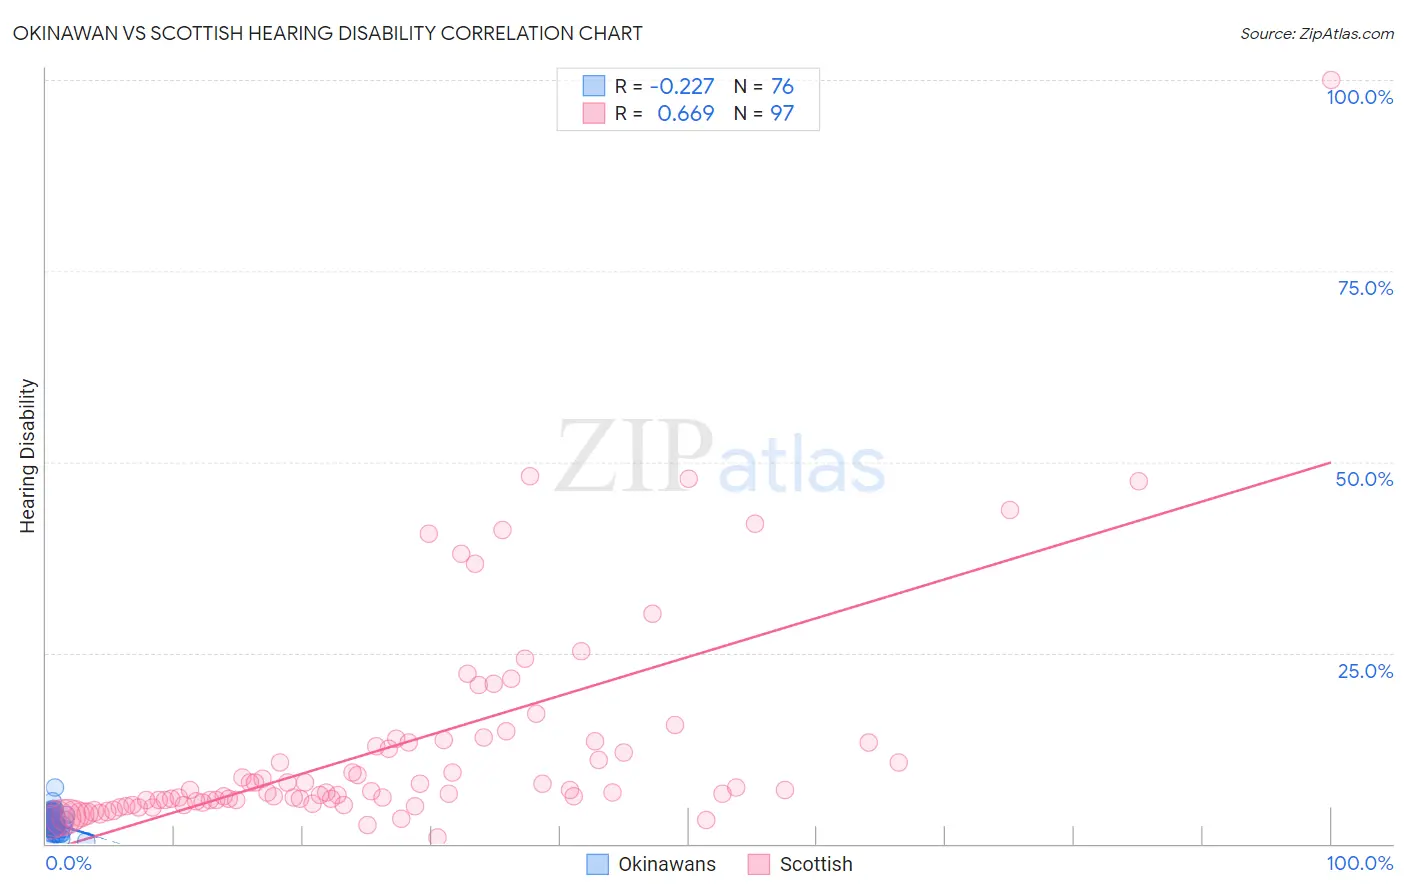
Okinawan vs Scottish Hearing Disability Correlation Chart
The statistical analysis conducted on geographies consisting of 73,759,317 people shows a weak negative correlation between the proportion of Okinawans and percentage of population with hearing disability in the United States with a correlation coefficient (R) of -0.227 and weighted average of 2.6%. Similarly, the statistical analysis conducted on geographies consisting of 566,483,062 people shows a significant positive correlation between the proportion of Scottish and percentage of population with hearing disability in the United States with a correlation coefficient (R) of 0.669 and weighted average of 3.7%, a difference of 42.9%.
Hearing Disability Correlation Summary
| Measurement | Okinawan | Scottish |
| Minimum | 0.40% | 0.87% |
| Maximum | 7.3% | 100.0% |
| Range | 6.9% | 99.1% |
| Mean | 2.7% | 12.6% |
| Median | 2.6% | 6.8% |
| Interquartile 25% (IQ1) | 2.3% | 5.4% |
| Interquartile 75% (IQ3) | 3.2% | 13.4% |
| Interquartile Range (IQR) | 0.90% | 8.0% |
| Standard Deviation (Sample) | 1.1% | 14.5% |
| Standard Deviation (Population) | 1.1% | 14.4% |
Similar Demographics by Hearing Disability
Demographics Similar to Okinawans by Hearing Disability
In terms of hearing disability, the demographic groups most similar to Okinawans are Immigrants from Western Africa (2.6%, a difference of 0.020%), Immigrants from Jamaica (2.6%, a difference of 0.11%), Salvadoran (2.6%, a difference of 0.22%), Immigrants from Pakistan (2.6%, a difference of 0.35%), and Immigrants from China (2.6%, a difference of 0.35%).
| Demographics | Rating | Rank | Hearing Disability |
| Bolivians | 99.7 /100 | #29 | Exceptional 2.6% |
| Immigrants | Caribbean | 99.7 /100 | #30 | Exceptional 2.6% |
| Immigrants | Cameroon | 99.7 /100 | #31 | Exceptional 2.6% |
| Immigrants | Venezuela | 99.7 /100 | #32 | Exceptional 2.6% |
| Filipinos | 99.6 /100 | #33 | Exceptional 2.6% |
| Immigrants | Pakistan | 99.6 /100 | #34 | Exceptional 2.6% |
| Salvadorans | 99.6 /100 | #35 | Exceptional 2.6% |
| Okinawans | 99.6 /100 | #36 | Exceptional 2.6% |
| Immigrants | Western Africa | 99.6 /100 | #37 | Exceptional 2.6% |
| Immigrants | Jamaica | 99.5 /100 | #38 | Exceptional 2.6% |
| Immigrants | China | 99.5 /100 | #39 | Exceptional 2.6% |
| Haitians | 99.5 /100 | #40 | Exceptional 2.6% |
| Immigrants | Taiwan | 99.4 /100 | #41 | Exceptional 2.6% |
| West Indians | 99.4 /100 | #42 | Exceptional 2.6% |
| Senegalese | 99.4 /100 | #43 | Exceptional 2.6% |
Demographics Similar to Scottish by Hearing Disability
In terms of hearing disability, the demographic groups most similar to Scottish are Pennsylvania German (3.7%, a difference of 0.030%), German (3.7%, a difference of 0.060%), Dutch (3.7%, a difference of 0.13%), Menominee (3.7%, a difference of 0.19%), and Celtic (3.7%, a difference of 0.34%).
| Demographics | Rating | Rank | Hearing Disability |
| Norwegians | 0.0 /100 | #293 | Tragic 3.7% |
| Iroquois | 0.0 /100 | #294 | Tragic 3.7% |
| Welsh | 0.0 /100 | #295 | Tragic 3.7% |
| Pima | 0.0 /100 | #296 | Tragic 3.7% |
| Immigrants | Azores | 0.0 /100 | #297 | Tragic 3.7% |
| Celtics | 0.0 /100 | #298 | Tragic 3.7% |
| Germans | 0.0 /100 | #299 | Tragic 3.7% |
| Scottish | 0.0 /100 | #300 | Tragic 3.7% |
| Pennsylvania Germans | 0.0 /100 | #301 | Tragic 3.7% |
| Dutch | 0.0 /100 | #302 | Tragic 3.7% |
| Menominee | 0.0 /100 | #303 | Tragic 3.7% |
| French | 0.0 /100 | #304 | Tragic 3.8% |
| English | 0.0 /100 | #305 | Tragic 3.8% |
| Marshallese | 0.0 /100 | #306 | Tragic 3.8% |
| French Canadians | 0.0 /100 | #307 | Tragic 3.8% |