Immigrants from the Azores vs Estonian Hearing Disability
COMPARE
Immigrants from the Azores
Estonian
Hearing Disability
Hearing Disability Comparison
Immigrants from the Azores
Estonians
3.7%
HEARING DISABILITY
0.0/ 100
METRIC RATING
297th/ 347
METRIC RANK
3.3%
HEARING DISABILITY
2.4/ 100
METRIC RATING
233rd/ 347
METRIC RANK
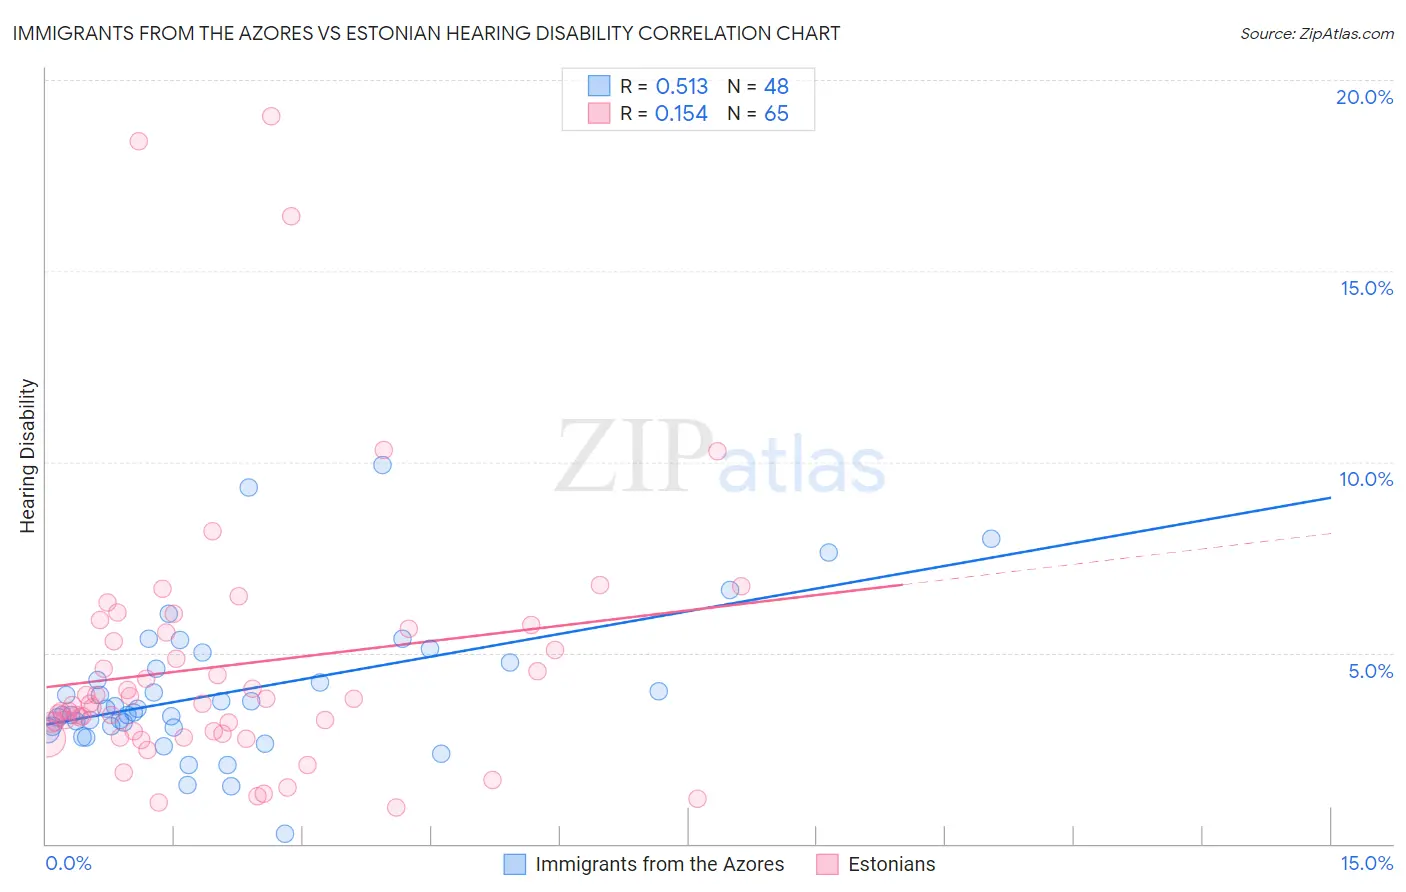
Immigrants from the Azores vs Estonian Hearing Disability Correlation Chart
The statistical analysis conducted on geographies consisting of 46,255,123 people shows a substantial positive correlation between the proportion of Immigrants from the Azores and percentage of population with hearing disability in the United States with a correlation coefficient (R) of 0.513 and weighted average of 3.7%. Similarly, the statistical analysis conducted on geographies consisting of 123,522,478 people shows a poor positive correlation between the proportion of Estonians and percentage of population with hearing disability in the United States with a correlation coefficient (R) of 0.154 and weighted average of 3.3%, a difference of 14.1%.
Hearing Disability Correlation Summary
| Measurement | Immigrants from the Azores | Estonian |
| Minimum | 0.28% | 0.96% |
| Maximum | 9.9% | 19.0% |
| Range | 9.6% | 18.1% |
| Mean | 4.0% | 4.7% |
| Median | 3.5% | 3.7% |
| Interquartile 25% (IQ1) | 3.1% | 2.9% |
| Interquartile 75% (IQ3) | 4.7% | 5.6% |
| Interquartile Range (IQR) | 1.6% | 2.7% |
| Standard Deviation (Sample) | 1.9% | 3.5% |
| Standard Deviation (Population) | 1.9% | 3.5% |
Similar Demographics by Hearing Disability
Demographics Similar to Immigrants from the Azores by Hearing Disability
In terms of hearing disability, the demographic groups most similar to Immigrants from the Azores are Pima (3.7%, a difference of 0.070%), Celtic (3.7%, a difference of 0.19%), Welsh (3.7%, a difference of 0.20%), Iroquois (3.7%, a difference of 0.46%), and German (3.7%, a difference of 0.47%).
| Demographics | Rating | Rank | Hearing Disability |
| Whites/Caucasians | 0.0 /100 | #290 | Tragic 3.7% |
| Finns | 0.0 /100 | #291 | Tragic 3.7% |
| Native Hawaiians | 0.0 /100 | #292 | Tragic 3.7% |
| Norwegians | 0.0 /100 | #293 | Tragic 3.7% |
| Iroquois | 0.0 /100 | #294 | Tragic 3.7% |
| Welsh | 0.0 /100 | #295 | Tragic 3.7% |
| Pima | 0.0 /100 | #296 | Tragic 3.7% |
| Immigrants | Azores | 0.0 /100 | #297 | Tragic 3.7% |
| Celtics | 0.0 /100 | #298 | Tragic 3.7% |
| Germans | 0.0 /100 | #299 | Tragic 3.7% |
| Scottish | 0.0 /100 | #300 | Tragic 3.7% |
| Pennsylvania Germans | 0.0 /100 | #301 | Tragic 3.7% |
| Dutch | 0.0 /100 | #302 | Tragic 3.7% |
| Menominee | 0.0 /100 | #303 | Tragic 3.7% |
| French | 0.0 /100 | #304 | Tragic 3.8% |
Demographics Similar to Estonians by Hearing Disability
In terms of hearing disability, the demographic groups most similar to Estonians are Central American Indian (3.3%, a difference of 0.070%), Guamanian/Chamorro (3.3%, a difference of 0.17%), Serbian (3.3%, a difference of 0.24%), Ukrainian (3.2%, a difference of 0.37%), and Luxembourger (3.2%, a difference of 0.42%).
| Demographics | Rating | Rank | Hearing Disability |
| Lebanese | 5.0 /100 | #226 | Tragic 3.2% |
| Bhutanese | 4.6 /100 | #227 | Tragic 3.2% |
| Immigrants | Portugal | 4.3 /100 | #228 | Tragic 3.2% |
| Maltese | 4.1 /100 | #229 | Tragic 3.2% |
| Greeks | 3.2 /100 | #230 | Tragic 3.2% |
| Luxembourgers | 2.9 /100 | #231 | Tragic 3.2% |
| Ukrainians | 2.9 /100 | #232 | Tragic 3.2% |
| Estonians | 2.4 /100 | #233 | Tragic 3.3% |
| Central American Indians | 2.3 /100 | #234 | Tragic 3.3% |
| Guamanians/Chamorros | 2.2 /100 | #235 | Tragic 3.3% |
| Serbians | 2.2 /100 | #236 | Tragic 3.3% |
| Immigrants | Austria | 1.8 /100 | #237 | Tragic 3.3% |
| German Russians | 1.8 /100 | #238 | Tragic 3.3% |
| Nepalese | 1.2 /100 | #239 | Tragic 3.3% |
| Immigrants | Netherlands | 1.1 /100 | #240 | Tragic 3.3% |