Okinawan vs Lumbee Hearing Disability
COMPARE
Okinawan
Lumbee
Hearing Disability
Hearing Disability Comparison
Okinawans
Lumbee
2.6%
HEARING DISABILITY
99.6/ 100
METRIC RATING
36th/ 347
METRIC RANK
4.1%
HEARING DISABILITY
0.0/ 100
METRIC RATING
325th/ 347
METRIC RANK
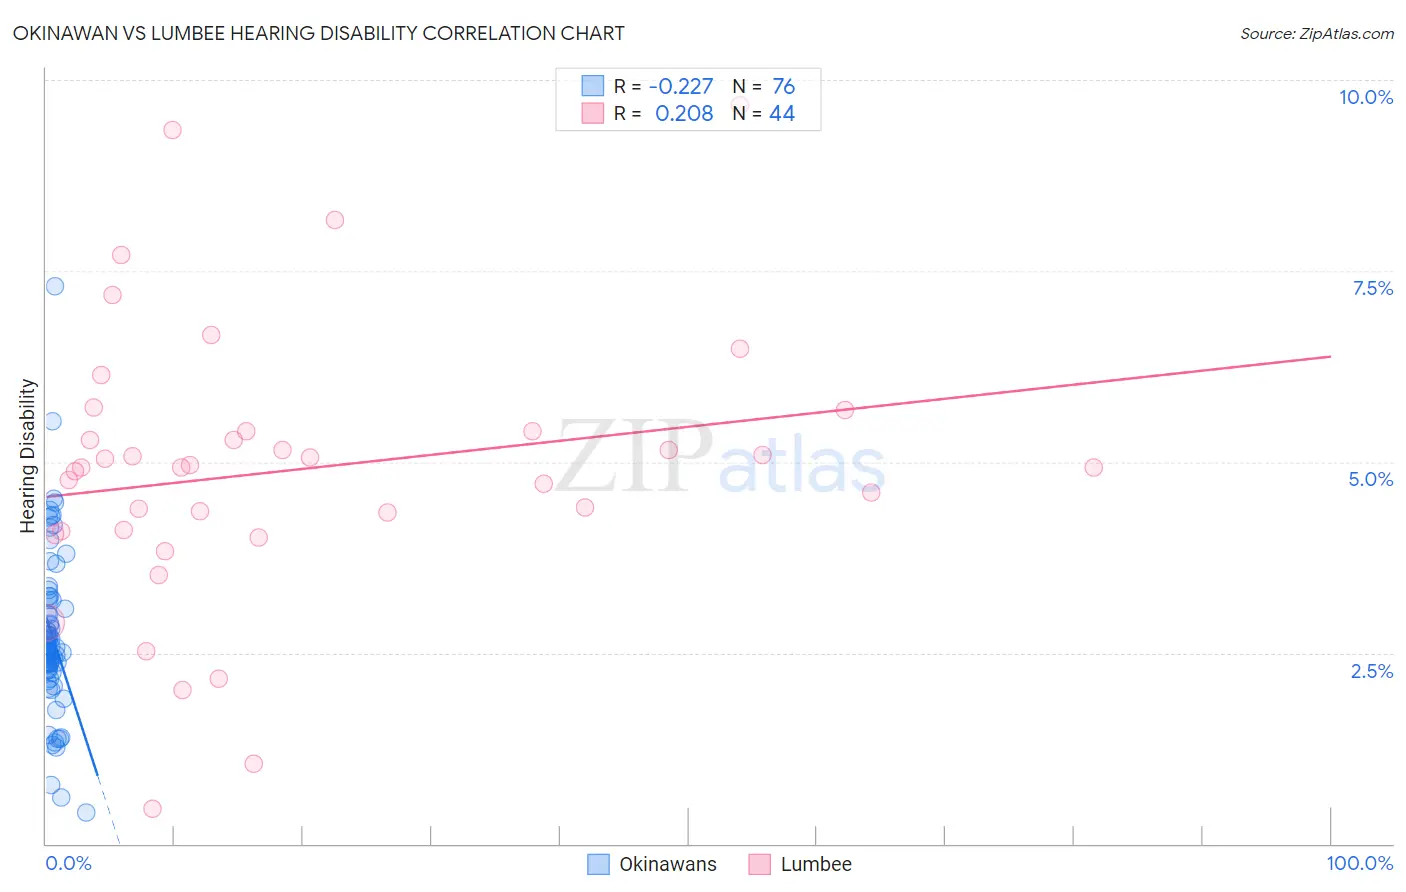
Okinawan vs Lumbee Hearing Disability Correlation Chart
The statistical analysis conducted on geographies consisting of 73,759,317 people shows a weak negative correlation between the proportion of Okinawans and percentage of population with hearing disability in the United States with a correlation coefficient (R) of -0.227 and weighted average of 2.6%. Similarly, the statistical analysis conducted on geographies consisting of 92,274,524 people shows a weak positive correlation between the proportion of Lumbee and percentage of population with hearing disability in the United States with a correlation coefficient (R) of 0.208 and weighted average of 4.1%, a difference of 57.1%.
Hearing Disability Correlation Summary
| Measurement | Okinawan | Lumbee |
| Minimum | 0.40% | 0.45% |
| Maximum | 7.3% | 9.7% |
| Range | 6.9% | 9.2% |
| Mean | 2.7% | 4.9% |
| Median | 2.6% | 4.9% |
| Interquartile 25% (IQ1) | 2.3% | 4.1% |
| Interquartile 75% (IQ3) | 3.2% | 5.4% |
| Interquartile Range (IQR) | 0.90% | 1.3% |
| Standard Deviation (Sample) | 1.1% | 1.8% |
| Standard Deviation (Population) | 1.1% | 1.8% |
Similar Demographics by Hearing Disability
Demographics Similar to Okinawans by Hearing Disability
In terms of hearing disability, the demographic groups most similar to Okinawans are Immigrants from Western Africa (2.6%, a difference of 0.020%), Immigrants from Jamaica (2.6%, a difference of 0.11%), Salvadoran (2.6%, a difference of 0.22%), Immigrants from Pakistan (2.6%, a difference of 0.35%), and Immigrants from China (2.6%, a difference of 0.35%).
| Demographics | Rating | Rank | Hearing Disability |
| Bolivians | 99.7 /100 | #29 | Exceptional 2.6% |
| Immigrants | Caribbean | 99.7 /100 | #30 | Exceptional 2.6% |
| Immigrants | Cameroon | 99.7 /100 | #31 | Exceptional 2.6% |
| Immigrants | Venezuela | 99.7 /100 | #32 | Exceptional 2.6% |
| Filipinos | 99.6 /100 | #33 | Exceptional 2.6% |
| Immigrants | Pakistan | 99.6 /100 | #34 | Exceptional 2.6% |
| Salvadorans | 99.6 /100 | #35 | Exceptional 2.6% |
| Okinawans | 99.6 /100 | #36 | Exceptional 2.6% |
| Immigrants | Western Africa | 99.6 /100 | #37 | Exceptional 2.6% |
| Immigrants | Jamaica | 99.5 /100 | #38 | Exceptional 2.6% |
| Immigrants | China | 99.5 /100 | #39 | Exceptional 2.6% |
| Haitians | 99.5 /100 | #40 | Exceptional 2.6% |
| Immigrants | Taiwan | 99.4 /100 | #41 | Exceptional 2.6% |
| West Indians | 99.4 /100 | #42 | Exceptional 2.6% |
| Senegalese | 99.4 /100 | #43 | Exceptional 2.6% |
Demographics Similar to Lumbee by Hearing Disability
In terms of hearing disability, the demographic groups most similar to Lumbee are Potawatomi (4.1%, a difference of 0.29%), Osage (4.1%, a difference of 0.32%), Apache (4.1%, a difference of 0.39%), Seminole (4.1%, a difference of 0.51%), and Paiute (4.1%, a difference of 0.77%).
| Demographics | Rating | Rank | Hearing Disability |
| Cheyenne | 0.0 /100 | #318 | Tragic 4.0% |
| Chippewa | 0.0 /100 | #319 | Tragic 4.0% |
| Shoshone | 0.0 /100 | #320 | Tragic 4.0% |
| Paiute | 0.0 /100 | #321 | Tragic 4.1% |
| Seminole | 0.0 /100 | #322 | Tragic 4.1% |
| Apache | 0.0 /100 | #323 | Tragic 4.1% |
| Osage | 0.0 /100 | #324 | Tragic 4.1% |
| Lumbee | 0.0 /100 | #325 | Tragic 4.1% |
| Potawatomi | 0.0 /100 | #326 | Tragic 4.1% |
| Arapaho | 0.0 /100 | #327 | Tragic 4.1% |
| Tohono O'odham | 0.0 /100 | #328 | Tragic 4.2% |
| Crow | 0.0 /100 | #329 | Tragic 4.2% |
| Natives/Alaskans | 0.0 /100 | #330 | Tragic 4.2% |
| Cherokee | 0.0 /100 | #331 | Tragic 4.2% |
| Houma | 0.0 /100 | #332 | Tragic 4.2% |