Immigrants from Ethiopia vs Estonian Hearing Disability
COMPARE
Immigrants from Ethiopia
Estonian
Hearing Disability
Hearing Disability Comparison
Immigrants from Ethiopia
Estonians
2.7%
HEARING DISABILITY
99.0/ 100
METRIC RATING
55th/ 347
METRIC RANK
3.3%
HEARING DISABILITY
2.4/ 100
METRIC RATING
233rd/ 347
METRIC RANK
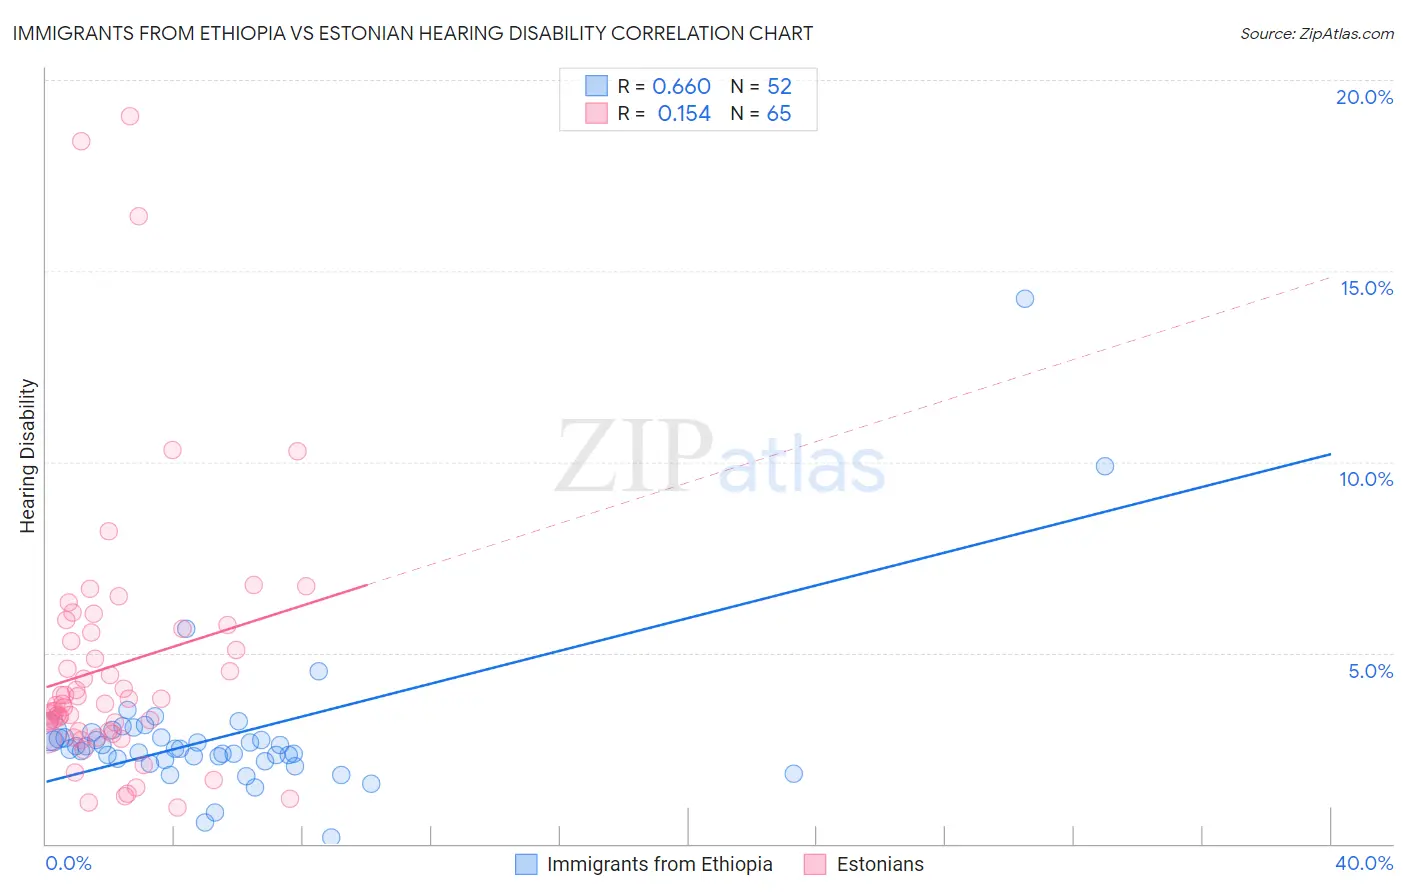
Immigrants from Ethiopia vs Estonian Hearing Disability Correlation Chart
The statistical analysis conducted on geographies consisting of 211,510,601 people shows a significant positive correlation between the proportion of Immigrants from Ethiopia and percentage of population with hearing disability in the United States with a correlation coefficient (R) of 0.660 and weighted average of 2.7%. Similarly, the statistical analysis conducted on geographies consisting of 123,522,478 people shows a poor positive correlation between the proportion of Estonians and percentage of population with hearing disability in the United States with a correlation coefficient (R) of 0.154 and weighted average of 3.3%, a difference of 21.7%.
Hearing Disability Correlation Summary
| Measurement | Immigrants from Ethiopia | Estonian |
| Minimum | 0.17% | 0.96% |
| Maximum | 14.3% | 19.0% |
| Range | 14.1% | 18.1% |
| Mean | 2.8% | 4.7% |
| Median | 2.5% | 3.7% |
| Interquartile 25% (IQ1) | 2.2% | 2.9% |
| Interquartile 75% (IQ3) | 2.9% | 5.6% |
| Interquartile Range (IQR) | 0.64% | 2.7% |
| Standard Deviation (Sample) | 2.1% | 3.5% |
| Standard Deviation (Population) | 2.1% | 3.5% |
Similar Demographics by Hearing Disability
Demographics Similar to Immigrants from Ethiopia by Hearing Disability
In terms of hearing disability, the demographic groups most similar to Immigrants from Ethiopia are Immigrants from Nicaragua (2.7%, a difference of 0.020%), Ethiopian (2.7%, a difference of 0.060%), South American (2.7%, a difference of 0.070%), Immigrants from Eastern Asia (2.7%, a difference of 0.10%), and Jamaican (2.7%, a difference of 0.16%).
| Demographics | Rating | Rank | Hearing Disability |
| Immigrants | Singapore | 99.3 /100 | #48 | Exceptional 2.6% |
| Immigrants | South America | 99.2 /100 | #49 | Exceptional 2.7% |
| Paraguayans | 99.2 /100 | #50 | Exceptional 2.7% |
| Immigrants | Hong Kong | 99.2 /100 | #51 | Exceptional 2.7% |
| Jamaicans | 99.0 /100 | #52 | Exceptional 2.7% |
| Immigrants | Eastern Asia | 99.0 /100 | #53 | Exceptional 2.7% |
| Ethiopians | 99.0 /100 | #54 | Exceptional 2.7% |
| Immigrants | Ethiopia | 99.0 /100 | #55 | Exceptional 2.7% |
| Immigrants | Nicaragua | 99.0 /100 | #56 | Exceptional 2.7% |
| South Americans | 99.0 /100 | #57 | Exceptional 2.7% |
| Immigrants | Peru | 98.6 /100 | #58 | Exceptional 2.7% |
| Immigrants | Eritrea | 98.5 /100 | #59 | Exceptional 2.7% |
| Immigrants | Egypt | 98.5 /100 | #60 | Exceptional 2.7% |
| Immigrants | Uzbekistan | 98.4 /100 | #61 | Exceptional 2.7% |
| Immigrants | Colombia | 98.4 /100 | #62 | Exceptional 2.7% |
Demographics Similar to Estonians by Hearing Disability
In terms of hearing disability, the demographic groups most similar to Estonians are Central American Indian (3.3%, a difference of 0.070%), Guamanian/Chamorro (3.3%, a difference of 0.17%), Serbian (3.3%, a difference of 0.24%), Ukrainian (3.2%, a difference of 0.37%), and Luxembourger (3.2%, a difference of 0.42%).
| Demographics | Rating | Rank | Hearing Disability |
| Lebanese | 5.0 /100 | #226 | Tragic 3.2% |
| Bhutanese | 4.6 /100 | #227 | Tragic 3.2% |
| Immigrants | Portugal | 4.3 /100 | #228 | Tragic 3.2% |
| Maltese | 4.1 /100 | #229 | Tragic 3.2% |
| Greeks | 3.2 /100 | #230 | Tragic 3.2% |
| Luxembourgers | 2.9 /100 | #231 | Tragic 3.2% |
| Ukrainians | 2.9 /100 | #232 | Tragic 3.2% |
| Estonians | 2.4 /100 | #233 | Tragic 3.3% |
| Central American Indians | 2.3 /100 | #234 | Tragic 3.3% |
| Guamanians/Chamorros | 2.2 /100 | #235 | Tragic 3.3% |
| Serbians | 2.2 /100 | #236 | Tragic 3.3% |
| Immigrants | Austria | 1.8 /100 | #237 | Tragic 3.3% |
| German Russians | 1.8 /100 | #238 | Tragic 3.3% |
| Nepalese | 1.2 /100 | #239 | Tragic 3.3% |
| Immigrants | Netherlands | 1.1 /100 | #240 | Tragic 3.3% |