Okinawan vs Indian (Asian) Hearing Disability
COMPARE
Okinawan
Indian (Asian)
Hearing Disability
Hearing Disability Comparison
Okinawans
Indians (Asian)
2.6%
HEARING DISABILITY
99.6/ 100
METRIC RATING
36th/ 347
METRIC RANK
2.7%
HEARING DISABILITY
98.4/ 100
METRIC RATING
63rd/ 347
METRIC RANK
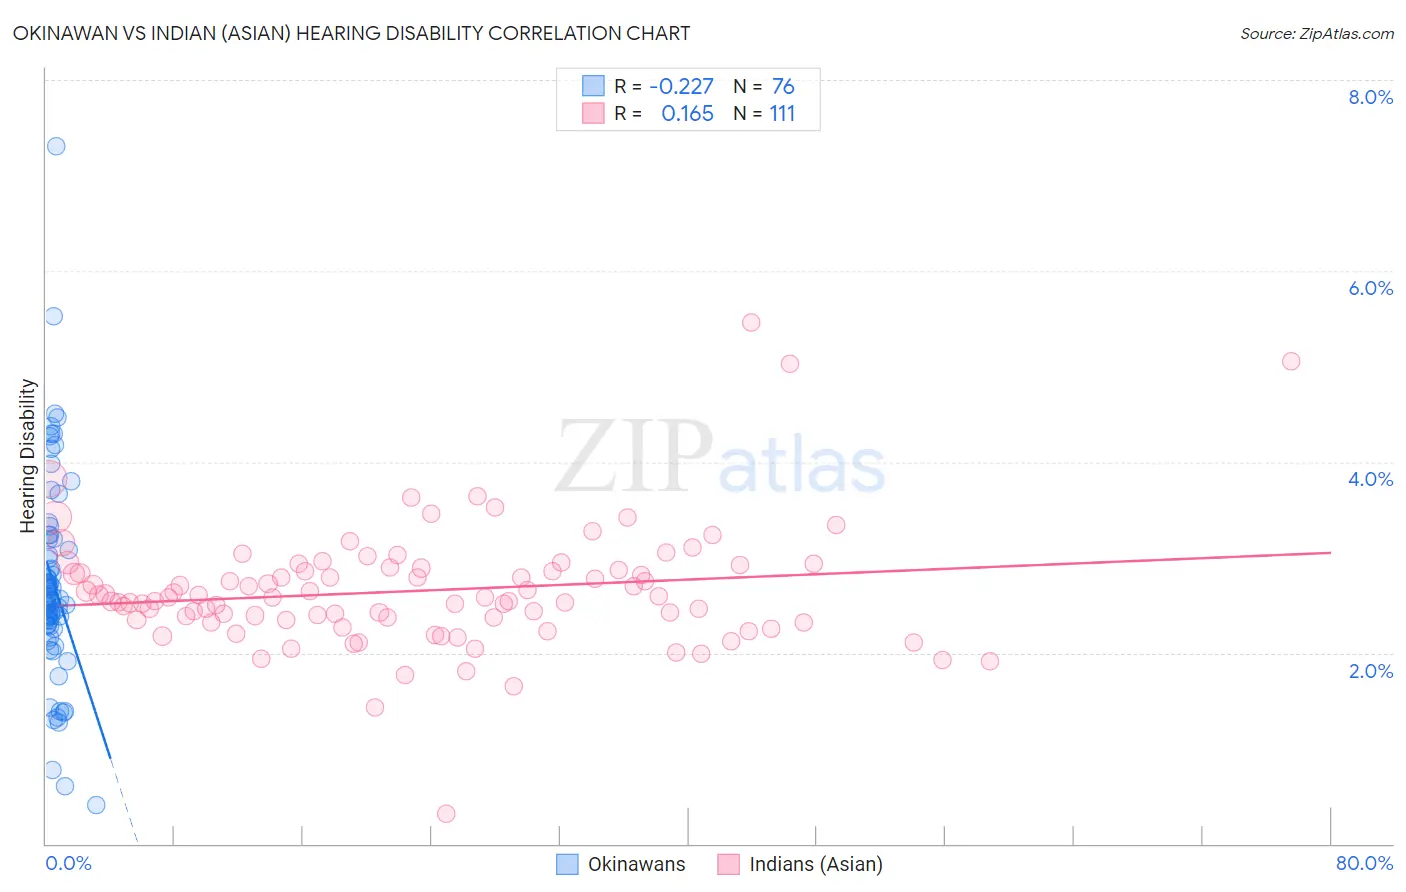
Okinawan vs Indian (Asian) Hearing Disability Correlation Chart
The statistical analysis conducted on geographies consisting of 73,759,317 people shows a weak negative correlation between the proportion of Okinawans and percentage of population with hearing disability in the United States with a correlation coefficient (R) of -0.227 and weighted average of 2.6%. Similarly, the statistical analysis conducted on geographies consisting of 494,958,947 people shows a poor positive correlation between the proportion of Indians (Asian) and percentage of population with hearing disability in the United States with a correlation coefficient (R) of 0.165 and weighted average of 2.7%, a difference of 3.5%.
Hearing Disability Correlation Summary
| Measurement | Okinawan | Indian (Asian) |
| Minimum | 0.40% | 0.32% |
| Maximum | 7.3% | 5.5% |
| Range | 6.9% | 5.1% |
| Mean | 2.7% | 2.6% |
| Median | 2.6% | 2.6% |
| Interquartile 25% (IQ1) | 2.3% | 2.3% |
| Interquartile 75% (IQ3) | 3.2% | 2.9% |
| Interquartile Range (IQR) | 0.90% | 0.54% |
| Standard Deviation (Sample) | 1.1% | 0.64% |
| Standard Deviation (Population) | 1.1% | 0.64% |
Similar Demographics by Hearing Disability
Demographics Similar to Okinawans by Hearing Disability
In terms of hearing disability, the demographic groups most similar to Okinawans are Immigrants from Western Africa (2.6%, a difference of 0.020%), Immigrants from Jamaica (2.6%, a difference of 0.11%), Salvadoran (2.6%, a difference of 0.22%), Immigrants from Pakistan (2.6%, a difference of 0.35%), and Immigrants from China (2.6%, a difference of 0.35%).
| Demographics | Rating | Rank | Hearing Disability |
| Bolivians | 99.7 /100 | #29 | Exceptional 2.6% |
| Immigrants | Caribbean | 99.7 /100 | #30 | Exceptional 2.6% |
| Immigrants | Cameroon | 99.7 /100 | #31 | Exceptional 2.6% |
| Immigrants | Venezuela | 99.7 /100 | #32 | Exceptional 2.6% |
| Filipinos | 99.6 /100 | #33 | Exceptional 2.6% |
| Immigrants | Pakistan | 99.6 /100 | #34 | Exceptional 2.6% |
| Salvadorans | 99.6 /100 | #35 | Exceptional 2.6% |
| Okinawans | 99.6 /100 | #36 | Exceptional 2.6% |
| Immigrants | Western Africa | 99.6 /100 | #37 | Exceptional 2.6% |
| Immigrants | Jamaica | 99.5 /100 | #38 | Exceptional 2.6% |
| Immigrants | China | 99.5 /100 | #39 | Exceptional 2.6% |
| Haitians | 99.5 /100 | #40 | Exceptional 2.6% |
| Immigrants | Taiwan | 99.4 /100 | #41 | Exceptional 2.6% |
| West Indians | 99.4 /100 | #42 | Exceptional 2.6% |
| Senegalese | 99.4 /100 | #43 | Exceptional 2.6% |
Demographics Similar to Indians (Asian) by Hearing Disability
In terms of hearing disability, the demographic groups most similar to Indians (Asian) are Immigrants from Colombia (2.7%, a difference of 0.050%), Immigrants from Sri Lanka (2.7%, a difference of 0.050%), Immigrants from Uzbekistan (2.7%, a difference of 0.060%), Immigrants from Nepal (2.7%, a difference of 0.14%), and Immigrants from Egypt (2.7%, a difference of 0.19%).
| Demographics | Rating | Rank | Hearing Disability |
| Immigrants | Nicaragua | 99.0 /100 | #56 | Exceptional 2.7% |
| South Americans | 99.0 /100 | #57 | Exceptional 2.7% |
| Immigrants | Peru | 98.6 /100 | #58 | Exceptional 2.7% |
| Immigrants | Eritrea | 98.5 /100 | #59 | Exceptional 2.7% |
| Immigrants | Egypt | 98.5 /100 | #60 | Exceptional 2.7% |
| Immigrants | Uzbekistan | 98.4 /100 | #61 | Exceptional 2.7% |
| Immigrants | Colombia | 98.4 /100 | #62 | Exceptional 2.7% |
| Indians (Asian) | 98.4 /100 | #63 | Exceptional 2.7% |
| Immigrants | Sri Lanka | 98.4 /100 | #64 | Exceptional 2.7% |
| Immigrants | Nepal | 98.3 /100 | #65 | Exceptional 2.7% |
| Immigrants | Belize | 98.2 /100 | #66 | Exceptional 2.7% |
| Egyptians | 98.1 /100 | #67 | Exceptional 2.7% |
| Immigrants | Africa | 98.0 /100 | #68 | Exceptional 2.7% |
| Nicaraguans | 97.9 /100 | #69 | Exceptional 2.7% |
| Peruvians | 97.7 /100 | #70 | Exceptional 2.7% |