Nonimmigrants vs Immigrants from Zimbabwe Ambulatory Disability
COMPARE
Nonimmigrants
Immigrants from Zimbabwe
Ambulatory Disability
Ambulatory Disability Comparison
Nonimmigrants
Immigrants from Zimbabwe
6.9%
AMBULATORY DISABILITY
0.0/ 100
METRIC RATING
288th/ 347
METRIC RANK
5.6%
AMBULATORY DISABILITY
99.8/ 100
METRIC RATING
58th/ 347
METRIC RANK
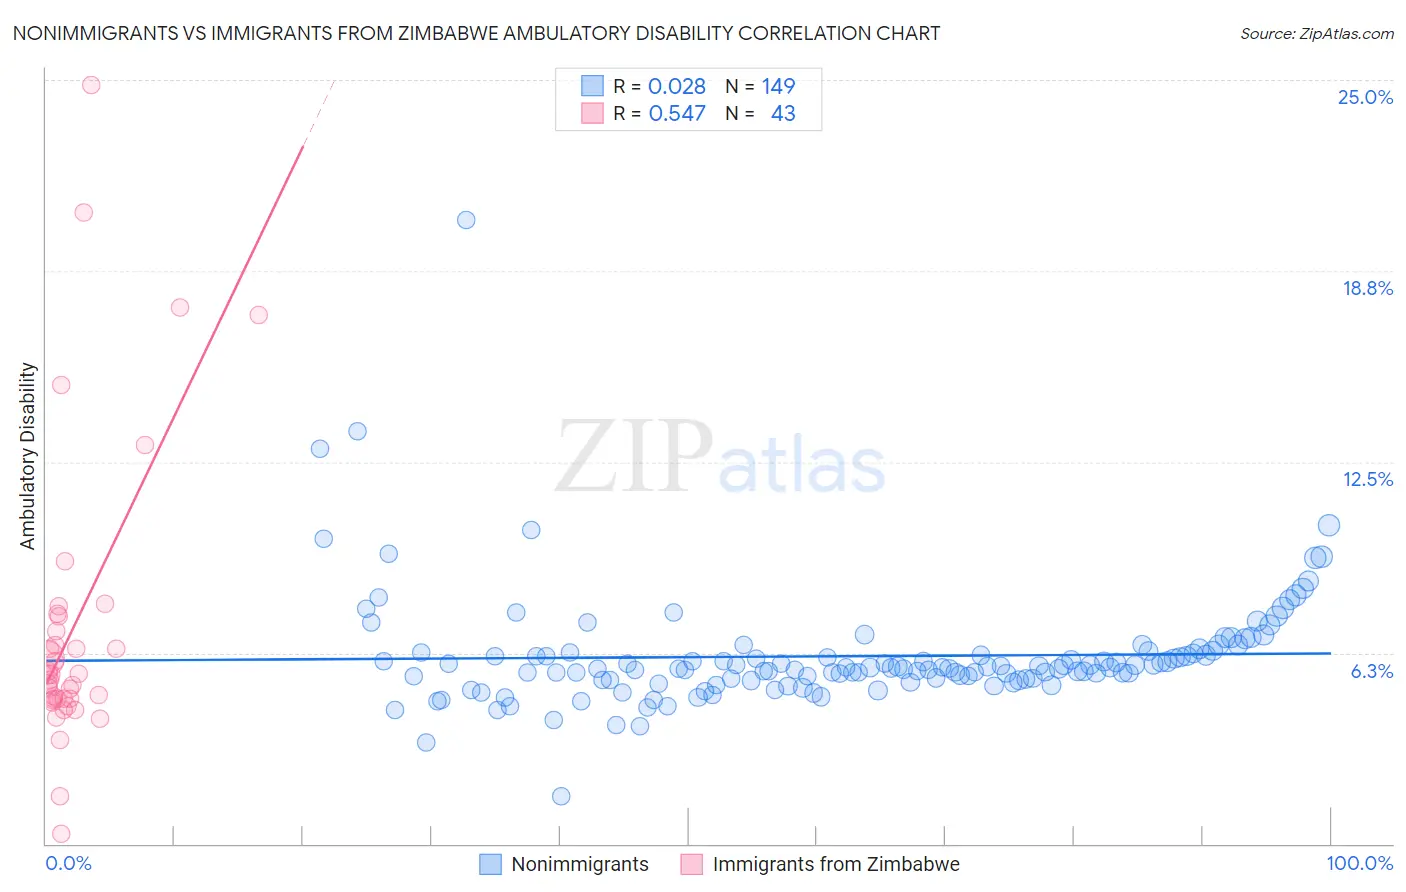
Nonimmigrants vs Immigrants from Zimbabwe Ambulatory Disability Correlation Chart
The statistical analysis conducted on geographies consisting of 584,325,810 people shows no correlation between the proportion of Nonimmigrants and percentage of population with ambulatory disability in the United States with a correlation coefficient (R) of 0.028 and weighted average of 6.9%. Similarly, the statistical analysis conducted on geographies consisting of 117,792,147 people shows a substantial positive correlation between the proportion of Immigrants from Zimbabwe and percentage of population with ambulatory disability in the United States with a correlation coefficient (R) of 0.547 and weighted average of 5.6%, a difference of 21.8%.
Ambulatory Disability Correlation Summary
| Measurement | Nonimmigrants | Immigrants from Zimbabwe |
| Minimum | 1.6% | 0.34% |
| Maximum | 20.4% | 24.9% |
| Range | 18.8% | 24.5% |
| Mean | 6.1% | 7.1% |
| Median | 5.8% | 5.5% |
| Interquartile 25% (IQ1) | 5.4% | 4.7% |
| Interquartile 75% (IQ3) | 6.2% | 7.5% |
| Interquartile Range (IQR) | 0.88% | 2.7% |
| Standard Deviation (Sample) | 1.9% | 4.9% |
| Standard Deviation (Population) | 1.9% | 4.9% |
Similar Demographics by Ambulatory Disability
Demographics Similar to Nonimmigrants by Ambulatory Disability
In terms of ambulatory disability, the demographic groups most similar to Nonimmigrants are Immigrants from Dominica (6.9%, a difference of 0.14%), Scotch-Irish (6.9%, a difference of 0.17%), U.S. Virgin Islander (6.8%, a difference of 0.27%), West Indian (6.9%, a difference of 0.27%), and Cheyenne (6.9%, a difference of 0.33%).
| Demographics | Rating | Rank | Ambulatory Disability |
| Yaqui | 0.0 /100 | #281 | Tragic 6.8% |
| Barbadians | 0.0 /100 | #282 | Tragic 6.8% |
| Immigrants | Barbados | 0.0 /100 | #283 | Tragic 6.8% |
| Immigrants | Jamaica | 0.0 /100 | #284 | Tragic 6.8% |
| Fijians | 0.0 /100 | #285 | Tragic 6.8% |
| Yakama | 0.0 /100 | #286 | Tragic 6.8% |
| U.S. Virgin Islanders | 0.0 /100 | #287 | Tragic 6.8% |
| Immigrants | Nonimmigrants | 0.0 /100 | #288 | Tragic 6.9% |
| Immigrants | Dominica | 0.0 /100 | #289 | Tragic 6.9% |
| Scotch-Irish | 0.0 /100 | #290 | Tragic 6.9% |
| West Indians | 0.0 /100 | #291 | Tragic 6.9% |
| Cheyenne | 0.0 /100 | #292 | Tragic 6.9% |
| Immigrants | St. Vincent and the Grenadines | 0.0 /100 | #293 | Tragic 6.9% |
| Cape Verdeans | 0.0 /100 | #294 | Tragic 6.9% |
| Crow | 0.0 /100 | #295 | Tragic 6.9% |
Demographics Similar to Immigrants from Zimbabwe by Ambulatory Disability
In terms of ambulatory disability, the demographic groups most similar to Immigrants from Zimbabwe are Immigrants from Afghanistan (5.6%, a difference of 0.040%), Immigrants from Brazil (5.6%, a difference of 0.060%), Immigrants from Lithuania (5.6%, a difference of 0.080%), Immigrants from Belgium (5.6%, a difference of 0.20%), and Immigrants from Spain (5.6%, a difference of 0.21%).
| Demographics | Rating | Rank | Ambulatory Disability |
| Taiwanese | 99.8 /100 | #51 | Exceptional 5.6% |
| Jordanians | 99.8 /100 | #52 | Exceptional 5.6% |
| Immigrants | Egypt | 99.8 /100 | #53 | Exceptional 5.6% |
| Immigrants | Eastern Africa | 99.8 /100 | #54 | Exceptional 5.6% |
| Immigrants | Bulgaria | 99.8 /100 | #55 | Exceptional 5.6% |
| Inupiat | 99.8 /100 | #56 | Exceptional 5.6% |
| Immigrants | Brazil | 99.8 /100 | #57 | Exceptional 5.6% |
| Immigrants | Zimbabwe | 99.8 /100 | #58 | Exceptional 5.6% |
| Immigrants | Afghanistan | 99.8 /100 | #59 | Exceptional 5.6% |
| Immigrants | Lithuania | 99.8 /100 | #60 | Exceptional 5.6% |
| Immigrants | Belgium | 99.7 /100 | #61 | Exceptional 5.6% |
| Immigrants | Spain | 99.7 /100 | #62 | Exceptional 5.6% |
| Immigrants | France | 99.7 /100 | #63 | Exceptional 5.6% |
| Laotians | 99.7 /100 | #64 | Exceptional 5.7% |
| Immigrants | Switzerland | 99.7 /100 | #65 | Exceptional 5.7% |