Nonimmigrants vs Celtic Ambulatory Disability
COMPARE
Nonimmigrants
Celtic
Ambulatory Disability
Ambulatory Disability Comparison
Nonimmigrants
Celtics
6.9%
AMBULATORY DISABILITY
0.0/ 100
METRIC RATING
288th/ 347
METRIC RANK
6.7%
AMBULATORY DISABILITY
0.1/ 100
METRIC RATING
276th/ 347
METRIC RANK
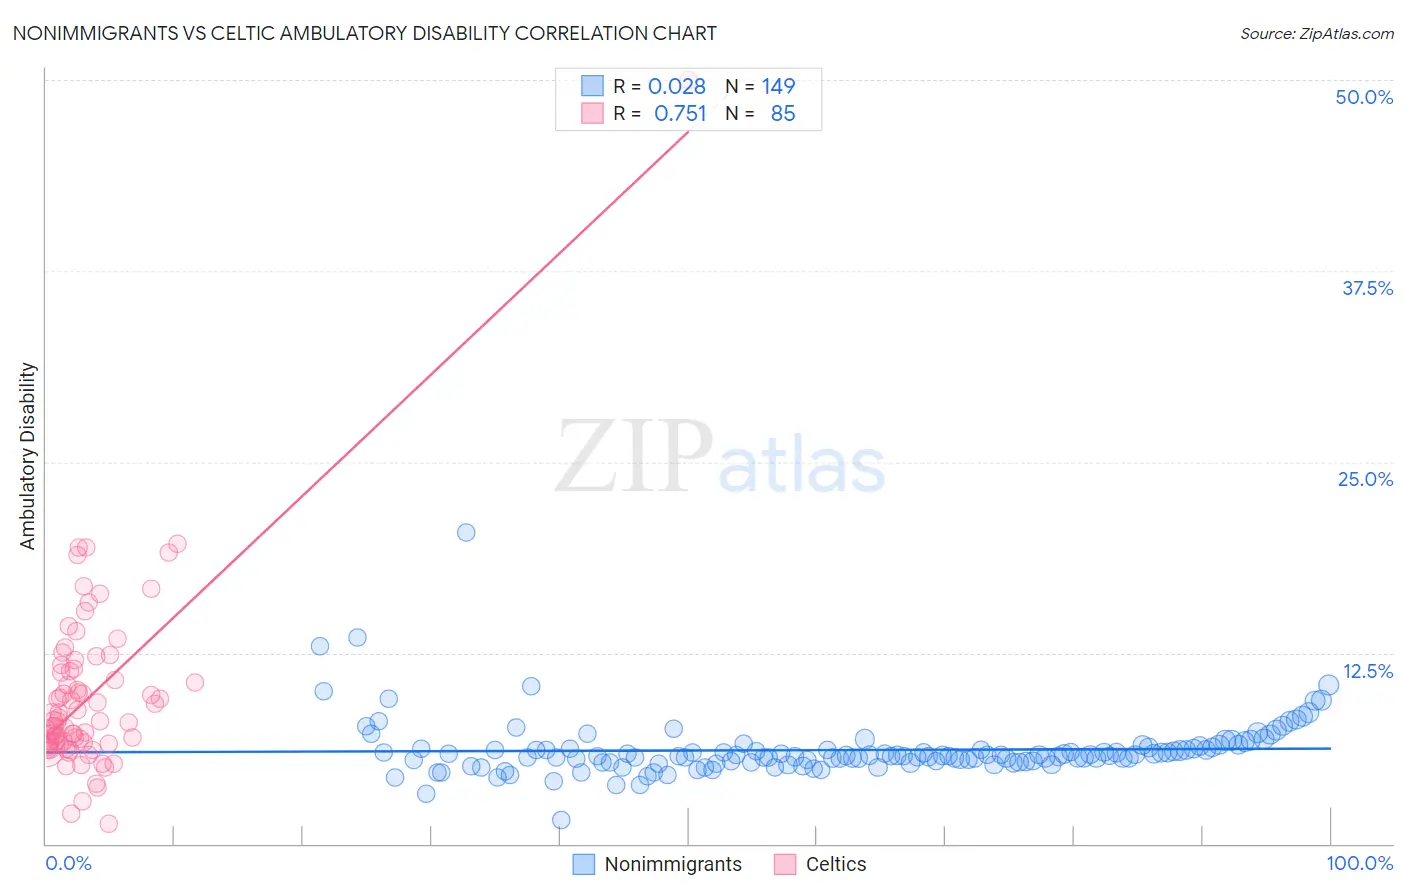
Nonimmigrants vs Celtic Ambulatory Disability Correlation Chart
The statistical analysis conducted on geographies consisting of 584,325,810 people shows no correlation between the proportion of Nonimmigrants and percentage of population with ambulatory disability in the United States with a correlation coefficient (R) of 0.028 and weighted average of 6.9%. Similarly, the statistical analysis conducted on geographies consisting of 168,862,473 people shows a strong positive correlation between the proportion of Celtics and percentage of population with ambulatory disability in the United States with a correlation coefficient (R) of 0.751 and weighted average of 6.7%, a difference of 2.1%.
Ambulatory Disability Correlation Summary
| Measurement | Nonimmigrants | Celtic |
| Minimum | 1.6% | 1.3% |
| Maximum | 20.4% | 50.0% |
| Range | 18.8% | 48.7% |
| Mean | 6.1% | 9.7% |
| Median | 5.8% | 8.0% |
| Interquartile 25% (IQ1) | 5.4% | 6.5% |
| Interquartile 75% (IQ3) | 6.2% | 11.4% |
| Interquartile Range (IQR) | 0.88% | 4.8% |
| Standard Deviation (Sample) | 1.9% | 6.0% |
| Standard Deviation (Population) | 1.9% | 6.0% |
Demographics Similar to Nonimmigrants and Celtics by Ambulatory Disability
In terms of ambulatory disability, the demographic groups most similar to Nonimmigrants are Immigrants from Dominica (6.9%, a difference of 0.14%), Scotch-Irish (6.9%, a difference of 0.17%), U.S. Virgin Islander (6.8%, a difference of 0.27%), West Indian (6.9%, a difference of 0.27%), and Cheyenne (6.9%, a difference of 0.33%). Similarly, the demographic groups most similar to Celtics are Immigrants from Guyana (6.7%, a difference of 0.030%), Jamaican (6.7%, a difference of 0.080%), Sioux (6.7%, a difference of 0.090%), Immigrants from West Indies (6.7%, a difference of 0.15%), and White/Caucasian (6.7%, a difference of 0.34%).
| Demographics | Rating | Rank | Ambulatory Disability |
| French Canadians | 0.1 /100 | #272 | Tragic 6.7% |
| Whites/Caucasians | 0.1 /100 | #273 | Tragic 6.7% |
| Sioux | 0.1 /100 | #274 | Tragic 6.7% |
| Immigrants | Guyana | 0.1 /100 | #275 | Tragic 6.7% |
| Celtics | 0.1 /100 | #276 | Tragic 6.7% |
| Jamaicans | 0.1 /100 | #277 | Tragic 6.7% |
| Immigrants | West Indies | 0.1 /100 | #278 | Tragic 6.7% |
| Immigrants | Caribbean | 0.0 /100 | #279 | Tragic 6.7% |
| Pennsylvania Germans | 0.0 /100 | #280 | Tragic 6.8% |
| Yaqui | 0.0 /100 | #281 | Tragic 6.8% |
| Barbadians | 0.0 /100 | #282 | Tragic 6.8% |
| Immigrants | Barbados | 0.0 /100 | #283 | Tragic 6.8% |
| Immigrants | Jamaica | 0.0 /100 | #284 | Tragic 6.8% |
| Fijians | 0.0 /100 | #285 | Tragic 6.8% |
| Yakama | 0.0 /100 | #286 | Tragic 6.8% |
| U.S. Virgin Islanders | 0.0 /100 | #287 | Tragic 6.8% |
| Immigrants | Nonimmigrants | 0.0 /100 | #288 | Tragic 6.9% |
| Immigrants | Dominica | 0.0 /100 | #289 | Tragic 6.9% |
| Scotch-Irish | 0.0 /100 | #290 | Tragic 6.9% |
| West Indians | 0.0 /100 | #291 | Tragic 6.9% |
| Cheyenne | 0.0 /100 | #292 | Tragic 6.9% |